Download
1 / 8
80 likes | 215 Vues
Monday 9-29-14. Fill out Planner for week Update SN (Journal check next week – Major Grade !!!) Check Stars in SN. Research Plans. Cite work in Research plans Controlled variables Multiple trials Upload Work Cited to Moodle Upload work cited with web address to Moodle.

E N D
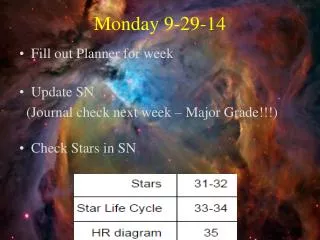
Monday 9-29-14 • Fill out Planner for week • Update SN (Journal check next week – Major Grade!!!) • Check Stars in SN
Research Plans • Cite work in Research plans • Controlled variables • Multiple trials • Upload Work Cited to Moodle • Upload work cited with web address to Moodle
Hertzsprung Russell Diagram (H-R) http://hrw.com • graph showing relationship between a star’s surface temperature and its Brightness
H-R Diagram in Notes • Color Code Each Spectral Type on HR Diagram
Label the following. Brightest Red Supergiants Red giants Blue Giants Red Dwarfs White Dwarfs Main sequence Sun Dimmest Cool Hot • Stars live most of their live in the main sequence. • As temperature increases for a main sequence star, brightness ________. increases
How does the location of stars plotted on the H-R diagram change as they evolve? Main sequence top right bottom