Download
1 / 44
450 likes | 617 Vues
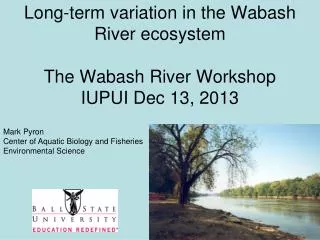
Long-term variation in the Wabash River ecosystem The Wabash River Workshop IUPUI Dec 13, 2013. Mark Pyron Center of Aquatic Biology and Fisheries Environmental Science. Background Side scan sonar Long term fish assemblage Size spectral analysis Isotope analyses. Wabash River.

E N D
Long-term variation in the Wabash River ecosystemThe Wabash River WorkshopIUPUI Dec 13, 2013 Mark Pyron Center of Aquatic Biology and Fisheries Environmental Science
Background • Side scan sonar • Long term fish assemblage • Size spectral analysis • Isotope analyses
Wabash River • 2nd largest trib of Ohio River • 85,000 km2 watershed • 764 km long
Upstream Wabash River: medium-sized river with gravel substrates
1. Fish data James Gammon 1974-98 Mark Pyron 2000-8 230 km
Jim Gammon began project 1974-98 500-m sites Boat electrofishing
Sampling Protocol: • Electrofish 500 m • Collect all fishes • Measure, release
Fish assemblage patterns • Major gradient = river distance: substrate and habitat variation • Species separate along gradients
Upstream: riffles, pools, gravel-cobble Blue sucker River redhorse
Shovelnose sturgeon Everywhere = Freshwater drum
Downstream: runs, sand-silt Flathead catfish Bigmouth buffalo
Sauger Longnose gar
GIS Approach to Analysis of Fish Assemblages Using Bathymetry, Water Velocity, Sediment and Woody Debris Mark Pyron, Reuben Goforth, Jayson Beugly, Scott Morlock, Moon Kim
Sample 1: June 2009 Acoustic Doppler Current Profiler Interfaced with Differential Global Positioning System receiver 10-km reach at Lafayette, Indiana
Three boats collect fishes: Ball State, Purdue, IDNR • Left, Center, Right bank • Individual fish assigned lat-long GPS coordinate
Majority of fishes along banksBlue suckerCarpsuckerFreshwater drum
Summer 2012 • Sidescan sonar map; most of Wabash River • Collect fishes at four locations • Predict assemblages for entire river
CCA: species and environmental variables MEAN DEPTH Gravel
Long term fish assemblage • Size spectral analysis • Time lag ordination • Isotope analyses
Size spectral analysis: examine organisms by size Convert size-abundance matrix into size bins Regress abundances against size bins
Examine organisms by size Convert size-abundance matrix into size bins Regress abundances against size bins Steeper with exploitation Steep regression = inefficient ecological transfer
Spectral analysis • Use only individuals > 162 mm SL • (susceptible to boat electrofisher) • Regime shift in 1990s?
steep regression = inefficient ecological transfer 1974-94 1994-1999 1999-2008
Diet of fishes change?Pilot analysis • Isotope analyses: 13C and 15N ratios Museum archives 1960-2008 Detritivore = gizzard shad Omnivore = spotfin shiner Piscivore = spotted bass
One trophic level ~ 3 ppt d15N Algae Macrophytes http://sofia.usgs.gov
Gizzard shad consume additional sources NANFA.ORG
Gizzard shad consume additional sources • Shiner consume lower trophic sources NANFA.ORG
Individuals consume lower trophic levels in upstream locations
Diet of consumer fishes (planktivore / omnivore) in 1990s Different algae? Different nutrients? Impact of Asian carp? Isotope RESULTS
Summary • Switch in functional group dominance • Omnivores + planktivores to benthivores • Asian carp cause change in food web?