Mathematical Modeling
Learn the basics of mathematical modeling and its application in computational scientific research. This course covers problem-solving steps, system dynamics, and practical tools like Excel. Enhance your understanding of building models and communicating mathematical concepts. Gain hands-on experience with assignments and tests.


Mathematical Modeling
E N D
Presentation Transcript
Mathematical Modeling UAB/EdGrid John C. Mayer UAB/Mathematics Graduate Assistants:Clinton CurryBrent Shivers
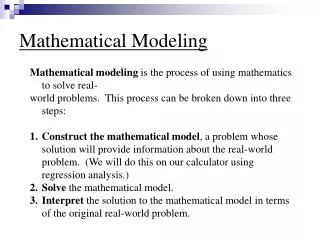
Mathematical Modeling • Creates a mathematical representation of some phenomenon to better understand it. • Matches observation with symbolic representation. • Informs theory and explanation. The success of a mathematical model depends on how easily it can be used, and how accurately it predicts and how well it explains the phenomenon being studied.
Mathematical Modeling • A mathematical model is central to most computational scientific research. • Other terms often used in connection with mathematical modeling are • Computer modeling • Computer simulation • Computational mathematics • Scientific Computation
Mathematical Modeling and the Scientific Method • How do we incorporate mathematical modeling/computational science in the scientific method?
Mathematical ModelingProblem-Solving Steps • Identify problem area • Conduct background research • State project goal • Define relationships • Develop mathematical model • Develop computational algorithm • Perform test calculations • Interpret results • Communicate results
Syllabus: MA 261/419/519 Spring, 2006
Syllabus: MA 261/419/519 • Introduction to Mathematical Modeling • Prerequisite: Calculus 1 • Goals • Learn to build models • Understand mathematics behind models • Improve understanding of mathematical concepts • Communicate mathematics • Models may be mathematical equations, spreadsheets, or computer simulations.
Contact Information • Instructor: Dr. John Mayer - CH 490A • mayer@math.uab.edu - 934-2154 • ?? • Assistant: Mr. Robert Cusimano - CH 478B • rob5236@uab.edu - 934-2154 • ??MW 4:00 – 5:30 PM (computer lab CB 112) • Assistant: Ms. Jeanine Sedjro – ?? • ?? • ??MW 6:45 – 8:00 PM (computer lab CB 112)
Class Meetings • Lectures. • Monday and Wednesday • 5:30 – 6:45 PM • CB15 112. • Computer lab. • Monday and Wednesday • 4:00 – 5:30 PM • 6:45 – 8:00 PM • CB15 112.
Software Tools • Spreadsheet: • Microsoft EXCEL • Compartmental Analysis and System Dynamics programming: • Isee Systems STELLA
Computer Lab • The only computer labs that have STELLA installed are CB15 112 and EDUC 149A. • Always bring a formatted 3.5” diskette to the lab. • Label disk: “Math Modeling, Spring, 2006, Your Name, Math Phone Number: 934-2154”
Assignments • One or two assignments every week. • First few assignments have two due dates. • Returned next class. • Re-Graded for improved grade. • Written work at most two authors. • You may work together with a partner on the computer.
Midterm Tests • Two tests, one about every 5 weeks. • Given in the computer lab. • Basic building blocks relevant to the kinds of models we are constructing. • Mathematics and logic behind the computer models.
System Dynamics Stories and Projects • System Dynamics Stories. • Scenarios describing realistic situations to be modeled. • Entirely independent work – no partners. • Construct model and write 5-10 page technical paper (template provided). • Project due date to be announced. • Begin work about middle of term. • Preliminary evaluation three weeks prior to due date.
Topics for Tools • Spreadsheet Models • Data analysis: curve fitting. • Recurrence Relations and difference equations. • Cellular Automata: nearest-neighbor averaging. • Compartmental Models • Introduction to System Dynamics. • Applications of System Dynamics. • System Dynamics Stories (guided projects).
Spreadsheet Models: Excel • Curve fitting – introduction to (linear) regression • Difference Equations: modeling growth • Nearest-neighbor averaging
Anthrax detected in Morteville Is terrorism the source? Infer geographic distribution from measures at several sample sites Build nearest neighbor averaging automaton in Excel Form hypothesis Get more data and compare Revise hypothesis Mortevilleby Doug Childers
How to Build a Stella Model Simple Population Models Generic Processes Advanced Population Models Drug Assimilation Epidemiology System Stories Compartmental Modeling
Population Model • Stella Model • Equations • Graphical Output Population(t) = Population(t - dt) + (Births - Deaths) * dt INIT Population = 100000 {people} INFLOWS: Births = Population*Fraction_That_Are_Female*Reproducing_Females*Births_per_Rep_Female {people/year} OUTFLOWS: Deaths = Population*Death_Fraction {people/year} Births_per_Rep_Female = 66/1000 {people/1000 rep females/year} Fraction_That_Are_Female = 0.5 {females/people} Reproducing_Females = .45 {rep females/female} Death_Fraction = GRAPH(Population) (120000, 0.01), (125000, 0.011), (130000, 0.013), (135000, 0.015), (140000, 0.017), (145000, 0.019), (150000, 0.02)
Generic Processes • Linear model with external resource • Exponential growth or decay model • Convergence model
Calculus Example STELLA Diagram Flow is proportional to X. • STELLA Equations: • Stock_X(t) = Stock_X(t - dt) + (Flow_1) * dt • INIT Stock_X = 100 • Flow_1 = Constant_a*Stock_X • Constant_a = .1
Connecting the Discrete to the Continuous • Stock_X(t) = Stock_X(t - dt) + (Flow_1) * dt • (Stock_X(t) - Stock_X(t - dt))/dt = Flow_1 • Flow_1 = Constant_a*Stock_X(t – dt) • (X(t) - X(t - dt))/dt = a X(t - dt) • Let dt go to 0 • dX/dt = a X(t) (a Differential Equation)
Solution to DE • dX/dt = a X(t) • dX/X(t) = a dt • Integrate • log (X(t)) = at + C • X(t) = exp(C) exp(at) • X(t) = X(0) exp(at)
System Dynamics Stories and Projects • Scenarios describing realistic situations to be modeled. • Fully independent work. • Construct model. • Write 5-10 page technical paper (template provided).
Boysen Dam has several purposes: It "provides regulation of the streamflow for power generation, irrigation, flood control, sediment retention, fish propagation, and recreation development." The United States Bureau of Reclamation, the government agency that runs the dam, would like to have some way of predicting how much power will be generated by this dam under certain conditions. – Clinton Curry Modeling a Dam 2 Boysen Dam
Modeling a Smallpox Epidemic • One infected terrorist comes to town • How does the system handle the epidemic under different assumptions? – Alicia Wilson