Mathematical Modeling
Learn how to model mathematical functions, interpret linear equations, and make predictions with data using function notation. Explore correlation coefficients, trendlines, and Excel tools for accurate forecasting.


Mathematical Modeling
E N D
Presentation Transcript
Mathematical Modeling Making Predictions with Data
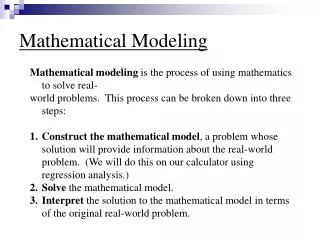
Function A rule that takes an input, transforms it, and produces a unique output • Can be represented by • a table that maps an input to an output • a graph • an equation involving two variables • Domain – the set of inputs • Range – the set of outputs t ≥ 0 y = 5t + 3 d ≥ 3
Linear Function A function that demonstrates a constant rate of change between two quantities • Can be represented by a line on a coordinate grid • Can be represented by a linear equation involving two variables • Can represent real-life situations • Distance traveled over time • Cost based on number of items purchased
Linear Equation A linear function can be expressed by a linear equation • An equation involving two variables • Independent variable, x • Horizontal axis • Dependent variable, y • Vertical axis • Variables can represent any two related quantities
Linear Equation • Data is often collected in tables • Data is graphed on a coordinate plane as ordered pairs (5, 28) (3, 18) (2, 13) 2 13
Linear Equation 3 y = 5x + 3 5 1 5 =
Function Notation • Functions often denoted by letters such as F, f, G, w, V, etc. • G(t) represents the output value of G at the input number t • Garbage production over time • t is a member of the Domain • t ≥ 0 • G(t) is a member of the Range • G(t) ≥ 427.92 tons • slope m = 20.05 tons/year • Garbage production increases by 20.05 tons/year
Function Notation • Example: d(t) = 5t +3 • Slope, m = 5 ft/s • The toy car moves 5 feet for every second of time • y-intercept, b = 3 ft • The toy car is initially 3 feet from the line at time t = 0 • What is the distance at t = 6 s • d(6) = 5 · (6) + 3 = 33 ft • When will the object be 23 feet from the line? • d(t) = 23 = 5t +3, t = 4
Correlation Coefficient, r • Measure of strength of a linear relation • -1 ≤ r ≤ 1 • r = ±1 is a perfect correlation • r = 0 indicates no correlation • Positive r indicates a direct relationship • As one variable increases, so does the other • Negative r indicates an inverse relationship • As one variable increases, the other decreases • Strength of relationship • r > 0.8 is a strong correlation • r < 0.5 is a weak correlation
Coefficient of Determination, r2 • Measure of how well the line represents the data • 0 ≤ r2≤ 1 • Portion of the variance of one variable that is predictable from the other • Example: r2 = 0.65, 65% of variation in y is due to x. The other 35% is due to other variable(s). • Square of the Correlation Coefficient
Finding Trendlines with Excel • Create table of data • Common practice to re-label years starting with n = 1 • Select data
Finding Trendlines with Excel • Insert Scatterplot
Finding Trendlines with Excel • Format the Scatterplot • Select the scatterplot • Choose the Layout tab • Chart Title • Axis Titles • Gridlines • Legend (delete)
Finding Trendlines with Excel • Format the Scatterplot • Select the scatterplot • Under Chart Tools • Choose Format tab • Select Horizontal (Value) Axis in drop down menu • Choose Format selection • Adjust the axis options • Select Vertical (Value) Axis • Choose Format selection • Adjust the axis options Note that the horizontal axis was formatted to show several years in the future.
Finding Trendlines with Excel • Add Trendline • Select the scatterplot • Under Chart Tools • Choose Layout tab • In the Analysis panel • Choose Linear Trendline • Select Trendline (either within chart or in Current Selection panel) • Forecast • Display Equation • Display R-squared value
Making Predictions • Use the trendline to make predictions • Function notation S(t) = 0.1335t+2.0269 where S(t) = projected sales t = year number (t = calendar year - 2002)
Making Predictions • Use the trendline to make predictions • What is the sales projection for 2015? t = 2015 – 2002 = 13 S(13) = 0.1335(13)+2.0269 = $3.76 million 2003 2015
Making Predictions 1.9731 2002 2003 2017