Download
1 / 90
950 likes | 1.21k Vues
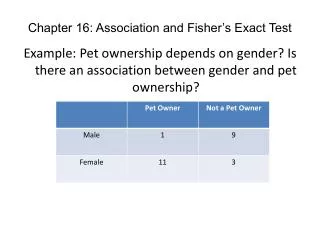
Allelic Association and Transmission Disequilibrium Test. 成大醫學院 病理科分子病理實驗室 分子診斷實驗室 呂政展 (x 2641). Linkage Disequilibrium (allelic association). Def: nonrandom association of alleles at linked loci f (A, B)= f (A) x f (B). :. Haplotype.

E N D
Allelic Association and Transmission Disequilibrium Test 成大醫學院 病理科分子病理實驗室 分子診斷實驗室 呂政展 (x 2641)
Linkage Disequilibrium (allelic association) • Def: nonrandom association of alleles at linked loci • f(A, B)= f(A) x f(B) • :
Haplotype • Haplotype: a series of alleles found at linked loci on a single chromosome. e.g, • A33-Cw10-B58-DRB1*0301-DQB1*02(6.3%); A2-B46-Cw11-DRB1*09-DQB1*0303 (orientals); • A30-Cw5-B18(Bw6)-DRB1*0301-DQB1*02(most frequent in Mediterranean) • A1-Cw7-B8(Bw6)-DRB1*0301- DQB1*02 (commonest in European Caucasoids)
The Relationship of Disease Locus and Marker Defined by Linkage Disequilibrium • The stronger the linkage disequilibrium, the closer the marker is to the disease locus • Mapping and/ or gene identification using LD is particularly useful in genetically unique or isolated populations (Amish and Finnish populations) • LD rarely extends more than 1 cM from the susceptibility locus, its detection indicates a significant narrow down of candidate region
Allelic Association Studies • How it happens? • Direct biological action of the genetic polymorphism • Linkage disequilibrium with a adjacent susceptibility gene • How useful in the analysis of genetic complex disease? • Evaluation of candidate gene loci • Fine mapping of region that is indicated by linkage analysis for follow-up studies
Association vs Linkage • Association and linkage: distinct from each other • Linkage: a specific genetic relationship between loci • Association: Statistical statement about the co-occurrence of alleles or phenotypes “Allele A is associated with disease D” : if individuals who have D also have Amore often than would be predicted from the individual frequencies of D and A in the population
Allelic Association • Def: A significantly increased or decreased frequency of a marker allele with a disease trait and represents deviations from the random occurrence of the alleles regarding the disease phenotypes • Linkage disequilibrium means allelic association caused or maintained by tight linkage
Linkage Disequilibrium in Genetic Analysis • Defining the ancestral haplotype of a disease gene in relation to several marker loci • Fine-mapping of the disease gene even when complete linkage ( = 0.0) is established in the family studies • The slowness of linkage disequilibrium decay make LD a useful mapping tool
Conditions for LD Mapping • Founder population • Geographically isolated population, traceable ancestry, most individuals of current population are descendants of a few individuals back 250 years ( 20 generations) • The prevalence of a genetic disease is derived from an allele for a disease gene from a common ancestor • Both parents in many of the marriages within a founder populations are heterozygous for a recessive disease gene, will have a 25% chance of having an affected offspring
Rate of Decay of Linkage Disequilibrium: time and distance-dependent • Dt = Do(1-)t • t : current generation number • Dt : current amount of disequilibrium • Do : disequilibrium at generation 0 • : recombination fraction between loci
Significance of Allelic Association • Allelic associations reflect sharing of ancestral chromosomes, only alleles at loci tightly linked to the disease susceptibility locus will still be shared • For a locus showing recombination fraction (θ) with the susceptibility locus, a proportion (θ ) of ancestral chromosome will lose the association each generation, and a proportion (1- θ) will retain it. • (1-0.01)44 = 0.64, loci 1cM apart • (1-0.03)44 = 0.26, loci 3 cM apart
Linkage Disequilibrium as a Mapping Tool-I Cystic fibrosis • mapped to 7q32, the candidate region was still very large • XV2.c and KM19 marker within the candidate gene show strong association between (XV2.c*1, KM19*2) haplotype and CF
Linkage Disequilibrium as a Mapping Tool-II Nijmegen breakage syndrome (NBS) • Rare autosomal recessive disease characterized by chromosomal breakage, growth retardation, microcephaly, immunodeficiency and a predisposition to cancer • Genetic linkage in families mapped NBS to an 8-Mb regions between D8S271 and D8S270
Linkage Disequilibrium as a Mapping Tool-II Nijmegen breakage syndrome (NBS) • 74 haplotypes related to a common ancestral haplotype. • Some do not have this haplotype, possibly carry independent NBS mutations. • Others share only part of haplotype, showing the effect of recombination in distant ancestors
Ancestral haplotype in patients with Nijmegen breakage syndrome A: allele attributed to AH 51 unrelated patients typed for microsatellites
Linkage Disequilibrium Mapping I1 I1 I2 I3 G1 G1 G3 G2 E1 E1 E1 E2 C1 C1 C1 C3 A1 A1 A1 A1 10 generations Mutation 90 generations N M M M N→M B1 B1 B1 B1 D1 D1 D1 D1 F1 F1 F1 F2 H1 H1 H1 H3 J1 J1 J3 J4 K1 K1 K4 K2
Jennings 1917 first developed the concept of LD • Richard Lewontin (1964) first used LD to measure D
Linkage Disequilibrium Coefficient (D)(Lewontin 1964) • D = P11- p1q1 (if D significantly differs from zero, LD is thought to exist) • P11 :observed frequency of the 1/1 haplotype • p1 :frequency of the allele “1” at the locus A • q1 : frequency of the allele “1” at the locus B locus A(1,2) locus B(1,2)
p1 = f(A1), p2 = 1- p1= f(A2) • q1 = f(B1), q2 = 1-q1 = f(B2) • Dmax = min(p1q2, p2q1) • Dmin = max(-p1q1, -p2q2) • D’ =D/Dmax • Alternatively,
D = h11- p1q1 , where h11 is the frequency of the haplotype with the rarer allele at each locus, and where p and q are frequencies of the rarer alleles at loci 1 and 2, respectively (Devlin and Risch, 1995). • D’ is positive when the rarer alleles at each locus are associated and is negative when a common allele is associated with a rare allele • Dmax = min[(pq, (1-p)(1-q)], for D <0 • Dmax = min[(p(1-q), q(1-p)], for D >0
Determination of LD Coefficient D = • a, b, c, d are the phenotype frequencies of the +/+, +/-, -/+ • and -/- combinations of the alleles in each haplotype and • n is the sum of the a, b, c, d. • HFij = Dij + GFi x GFj • GF = 1 -
Measure LD by D(2)(Hill and Robertson 1968) • R or =√2/N = D/√(p1p2q1q2) • 2 statistic= obtained from 2 x 2 table • N: total number of haplotypes in the sample Genome research 10: 1435-1444
Measure of LD-(3)(Bengtsson and Thomson 1981) • = D/(q1p22) • q1: The population frequency of a disease allele, B1 • P22: the frequency of chromosome that contain marker allele A2 and normal allele, B2
and D’ : give more reliable estimates of physical distances than do D and R, because D and R depends on allele frequency
Quantitative Measurement of Linkage Disequilibrium • Yule coefficient = (p1,1- p1,2)/(p1,1 + p1,2-2 p1,1p1,2)(used in Huntington’s disease) • p1,1 =the frequency of allele A1 on the chromosome carrying allele B1 • p1,2 = the frequency of allele A1 on the chromosome carrying allele B2 B1, B2 A1, A2 locus A locus B
Allelic association around the locus for Huntington Disease Acc I Total Distance= 2500 kb 250 kb Mbo I Taq I L19ps11 BS674
Advantages of Association Studies • Association studies are easier to conduct than linkage analysis , no multicase families or special family structures • LD is a short range phenomenon, if association exists, it defines a small candidate region in which to search for disease gene • Association is more powerful than linkage for detecting weak susceptibility alleles
Possible Causes of Positive Association-I • Direct causation: having allele A make you susceptible to disease D; possession of A is neither necessary nor sufficient to develop disease, but it increases the likelihood • Natural selection: People who have disease D might be more likely to survive and have children if they also have allele A • Population stratification: population contains several genetically distinct subsets. Both the disease D and allele A happen to be particularly frequent in one subset (HLA-A1 and chopsticks user in San Francisco bay area).
Possible Causes of Positive Association-II • Statistical artefact: association studies often tests a range of loci, each with several alleles, for association with a disease. The raw p values need correction for the numbers of genes tested • Linkage disequilibrium: If LD exist between the disease D and the locus A, there should be a gene near to the A locus that has mutations in people with disease D.
Advantages and Pitfalls of Association Study • Advantages • Not restricted to nonmendelian genetics • Easy to perform (case and control) • Pitfalls • Selection of controls is very crucial ( representative?!)
Probabilities calculated from Association studies must be corrected for the number of questions asked Threshold of significance is p = 0.05/n (Bonferroni correction)
Relative Risk (RR)/Odds Ratio(OR) • Estimate how many times more the carrier of a specific allele or haplotype was likely to have a specific disease associated with the particular genetic marker studied
Calculation of RR • RR= a x d/ b x c • a: the number of patients positive for the allele or haplotype • b: the number of patients negative for the allele or haplotype • c: the number of controls positive for the allele or haplotype • d: the number of controls negative for the allele or haplotype
Calculation of RR (Relative Risk) Sample Risk factor Cases Controls Total Present a b a+b Absent c d c+d Total a+c b+d n
Linkage disequilibrium mapping is carried out after genetic linkage between a polymorphic locus and the disease gene is determined
The Genetic Distance() between a Marker Locus and the Disease Gene that are in Linkage Disequilibrium-I • Pexcess= Paffected-Pnormal/(1- Pnormal)= (1- gq-1 )(1- )g • = recombination fraction between marker and disease loci • = mutation rate (1 x 10⁻⁶) • g= the number of generations after since the common ancestor • q= world wide frequency of the disease ( =0.001)
The Genetic Distance() between a Marker Locus and the Disease Gene that are in LD-II • Pnormal= the proportion of the marker allele in normal chromosomes • Paffected = the proportion of the marker allele in diseased chromosomes • Pexcess = measure of disequilibrium, the fraction of the excess occurrence of a chromosome with the disease gene and a marker allele compared with the chromosome with the nondisease gene and the marker allele
Functional SNPs in the lymphotoxin-α gene that are associated with susceptibility to myocardial infarction(Nature Genetics 32: 650-654, 2002) • Linkage disequilibrium mapping • Haplotype analysis • D’= D/Dmax
A cut-off P value of 0.01 for association in either recessive and dominant mode
A SNP in intron 1 of LTA (252A->G) on chromosome 6p21was associated with myocardial infraction in the initial screening
Construct a high-density SNP map for LD mapping by sequencing 16 MI patients and 16 normal controls. • 187 SNPs, 130 kb within 6p21 • Select 120 SNPs (>10%) and genotyping 94 MI patients and 94 subjects from general population • 26 SNPs with minor allele frequency > 0.25
1 2 3 4
Located in one extended block of intense LD, with D’ dropping off near p5-1 and AIF1 • They concluded that the gene associated with susceptibility to myocardial infraction was probably located between these two loci