Market equilibrium & disequilibrium
130 likes | 455 Vues
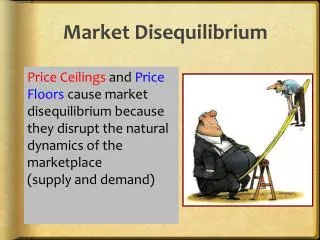
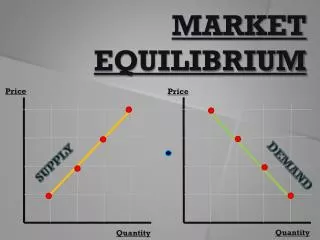
Market equilibrium & disequilibrium. equilibrium. where the supply and demand curves meet equilibrium price : P where Q D = Q S equilibrium quantity : Q where Q D = Q S. Disequilibrium (Q D ≠ Q S ). shortage Q D exceeds Q S fix: P . surplus Q S exceeds Q D fix: P .

Market equilibrium & disequilibrium
E N D
Presentation Transcript
equilibrium • where the supply and demand curves meet • equilibrium price: P where QD = QS • equilibrium quantity:Q where QD = QS
Disequilibrium (QD ≠ QS) shortage • QD exceeds QS • fix: P surplus • QS exceeds QD • fix: P
QD exceeds QS fix: P shortage
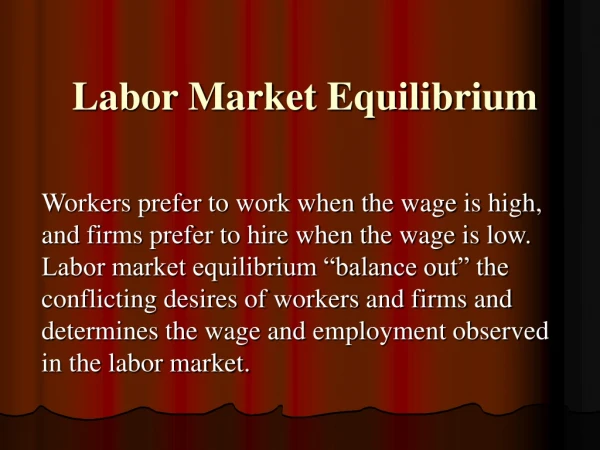
SHORTAGE (300 000) Shortage e E Supply d D c C Price (pence per kg) b B a A Demand Quantity (tonnes: 000s)
d D SURPLUS (330 000) Surplus e E Supply c C Price (pence per kg) b B a A Demand Quantity (tonnes: 000s)
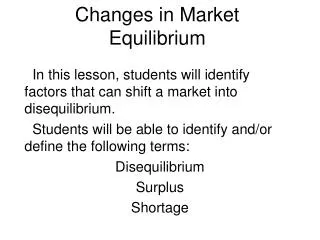
The Market S Price (£) A shift in the demand curve to the left will reduce the demand to 300 from 500 at a price of £5. Suppliers do not have the information or time to adjust supply immediately and still offer 600 for sale at £5. This results in a market surplus (S > D) In an attempt to get rid of surplus stock, producers will accept lower prices. Lower prices in turn attract some consumers to buy. The process continues until the surplus disappears and equilibrium is once again reached. Surplus £5 £3 D1 D 300 600 Quantity Bought and Sold (000s) 450
The Market S1 S Price (£) A shift in the supply curve to the left would lead to less products being available for sale at every price. Suppliers would only be able to offer 100 units for sale at a price of £5 but consumers still desire to purchase 600. This creates a market shortage. (S < D) The shortage in the market would drive up prices as some consumers are prepared to pay more. The price will continue to rise until the shortage has been competed away and a new equilibrium position has been reached. £8 £5 Shortage D 100 600 Quantity Bought and Sold (000s) 350
Governments impact market equilibrium price floor sets min. P above PE price ceiling sets max. P below PE