Download

1 / 38
380 likes | 401 Vues
NLANR/MNA aims to create a Network Analysis Infrastructure (NAI) to support measurements and network analysis, including header traces, performance statistics, tool development, and research activities. All data, analyses, graphs, and tools are made publicly available. The project also includes an Internet Trace User Community and active measurement project.

E N D
NLANR/MNA Measurement and Network Analysis Hans-Werner Braun Ronn Ritke NLANR/MNA (UCSD/SDSC) http://moat.nlanr.net/ Funded by the National Science Foundation/CISE/ANIR
Goals and objectives • Creation of the Network Analysis Infrastructure (NAI) to support measurements and network analysis • header traces, performance, statistics • Network measurement and analysis research activities • Tool development for analysis and visualizations • All data, analyses, graphs, visualizations, and tools are made public available for use by all researchers.
Public Interface • Internet Trace User Community • Attendance and presentation at meetings • Host PAM2003 Workshop. • Result reporting for the high performance environment • Web interface • newsletters (Networking Analysis Times, Packets) • published papers
NLANR/MNA Publications • 2002 - 5 • 2001 - 12 • 2000 - 8 • 1999 – 7 (28/32 were peer reviewed) • PAM2002 3/18 papers, 1/3 posters • http://moat.nlanr.net/Papers
Internet Trace User Community • Led by Joerg Micheel • We are seeking constructive discussion on monitor placement • strategies, trace duration, trace variety, etc. • For example, a number of researchers have requested longer duration traces. As a result, a set of passive traces from Auckland that consists of single and multiple day duration traces were made available. Researchers have published at least 7 papers based on those traces. • Which PMA trace summaries are most helpful in allowing other researchers to choose from available trace data sets?
Passive Measurement and Analysis (PMA) project (Passive traffic collection and analysis at optical carrier speeds) • Completely noninvasive, no impact on forwarding paths. • Aggregated traffic signature at a measurement point. • OC3/OC12, ATM and POS, OC48 (develop OC192 capability). • Between June 2000 and Jan 2001 (7 months) 6,000 PMA trace files were downloaded (31 per day) from at least 193 different sites. • Trace analysis summaries include (total packets, Bytes, top port numbers by volume, top 100 throughput connections, etc.)
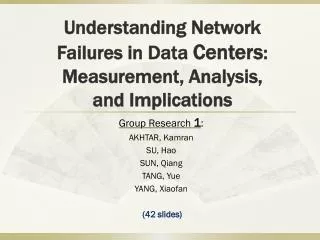
Passive measurement deployment status U. of Michigan Michigan State U. STARTAP/APAN NCAR U. Colorado, Boulder Argonne Nat. Lab Ohio State U. Columbia U. Front Range GigaPoP NCSA Colorado State FIX-West Indiana State Old Dominion U. AIX/MAE-West NASA-Ames MCNC North Carolina State U. U. of North Carolina Duke U. U. Memphis SDSC, U. California, San Diego Texas GigaPoP Tel Aviv U. (I-2) Rice U. Baylor College of Medicine U. of Houston Texas A&M U. U. of Florida Miami U. Florida State U. FDDI OC3 ATM OC3 PoS OC12 ATM OC12 PoS 26 September 2000
Top 100 PMA Throughput Connections rank Mbps Throughput site applic. triplet Bytes duration ==== =============== ======= =============== 1 50.763475 ANL 6:12061:6001 8690339 1.369542 2 49.993387 ANL 6:6001:12062 8690338 1.390638 3 46.130484 TXS 17:1033:9875 377307 0.065433 4 40.374478 ANL 6:6001:12127 8690339 1.721947 5 40.351682 ANL 6:6001:12080 8690340 1.722920 6 40.346389 ANL 6:6001:12081 8690340 1.723146 7 40.334325 ANL 6:6001:12064 8690338 1.723661 8 40.330446 ANL 6:6001:12121 8690339 1.723827 9 40.284595 ANL 6:6001:12116 8690339 1.725789 10 40.278924 ANL 6:6001:12142 8690339 1.726032
fiber connection end-point host system bus optical interfaces with own subsystem (e.g., DAG3, FORE) main system memory host collection and analysis process optical splitters optical interconnection fiber connection end-point Passive monitor components
Automated packet header trace collection 0 3 6 9 12 15 18 21 “n” seconds (e.g., 90) measurement maximum time for delayed start time for network analysis tasks remaining available time for transmission • collected every three hours from measurement objects • random start in first hour, but synchronized across machines • sent to central collector (via encrypted ssh) • daily analysis and encoded traces created • encoded files available via ftp and http NAI MOAT
Active Measurement Project (AMP) • Led by Tony McGregor • Focus on site-to-site measurement across high performance networks • Attempt to deploy FreeBSD-based AMP machines at all HPC sites • about 130 machines currently deployed and operational • RTT, topology, and loss; user/event driven throughput • We currently measure RTT to each of the other monitors every minute and the route to each every 10 minutes
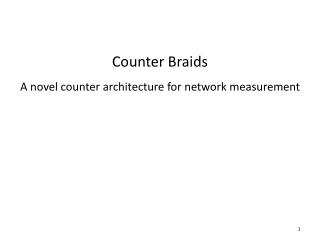
Active measurement deployment status UAlaska Washington State U. UWashington Oregon State Montana State MTU UVermont NDSU UWisc- Milwaukee UOregon UWisc MSU SDSMT Dartmouth URochester Startap WSU Iowa State UIowa NTNU MIT NWU UMass BU UWyoming UMich UIC PSU UConn Harvard FNAL Columbia Yale ColoState NCSA CMU/PSC UDel UPenn NCAR UIUC UMBC Princeton IU WVU JHU ACCESS UCBoulder Kansas State UMd UC NSF UMissouri GMU Georgetown UCB UofUtah UKansas UVirginia ODU Stanford SLAC Oklahoma State WUSTL UCSC NCREN/NCSC UTK Vanderbilt UofOklahoma UNC-CH Duke UCLA CSU-SB NCSU ASU GATech UC-Irvine UNM UAH CSUPomona Mississippi State UofGeorgia SDSC UArizona UCSD Emory U. SMU UAB SDSU NMSU UA FSU Rice UFlorida UHawaii UCF USF UMiami UWaikato 23 February 2000
Event Detection • Tony McGregor • AMP system consists of around 130 monitors in a full mesh. A set of graphs is available for each of the approximately 14,000 measured paths. • The Automated Event Detection is a system for detection of events in data collected by active monitors. • The system is divided into algorithms; each algorithm detects one class of network event. Currently, three algorithms are implemented. The "Plateau Detector" detects a change in the base RTT between a pair of monitors. A second algorithm detects a change in the RTT variance over a path. While the last algorithm triggers when packet losses are above an input threshold value.
Collaborations • Internet2 • 1. regarding the IPLS router instrumentation at the Indiana GigaPOP (Joerg Micheel in discussions with Matt Zekauskas). • 2. continuing discussions with I2 researchers regarding AMP involvement in E2E project (Tony McGregor, Ronn Ritke). • 3. participation on the Internet2 End-to-End Performance Initiative Design Team (Ronn Ritke). • Deployment of AMP machines at NASA Goddard and JPL. The machine at JPL is part of the JPL Performance Reference System. • We now have AMP monitors at LBNL, SLAC, Argonne National Lab and Fermi DOE facilities.
Collaborations (Cont’d) • Phil Dykstra and Cindy Dykstra, WareOnEarth (WCI, Inc.) • regarding the AMP peer network with Defense Research and Engineering Network (DREN), as well as other activities. • Other NLANR sites and their researchers and administrators, including weekly conference calls, and other activities. • Kevin Walsh and Jay Dombrowski network systems group at SDSC (SDSC Enterprise Network Services [ENS]) on creating the data compute engine/repository containing a replica of AMP data, as well as additional activities.
International Collaborations • Discussions with Tom DeFanti have included the monitoring of STAR LIGHT, and early insertion of optical splitters to allow quick installation of PMA machines. • We are in talks with AMPATH regarding the placement of an OCXmon and AMP machine to measure the traffic from AMPATH. • We are in contact with Greg Cole of FASTnet (formerly MIRnet) and are discussing several possible measurement activities.
International Collaborations (Cont’d) • We have a PMA monitor in Israel, and AMP machines in Korea, Norway, Australia, and New Zealand (soon Japan). • We are working with Canada, Korea, and Australia to help them install their own local AMP meshes. • We are working with the Pacific Rim Applications & Grid Middleware Assembly (PRAGMA) effort at SDSC. • Interest has also been expressed by other countries (Japan and Thailand) in both the AMP and PMA projects.
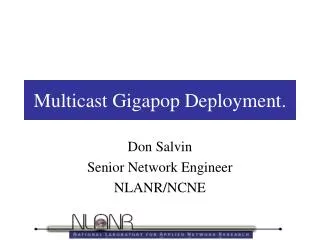
Pusan Taegu Kwangju Taejon Seoul Suwon HPCnet Renater 2 SingAREN HPCnet HPCnet HPCnet HPCnet KOREA Network Map : ~2001 KIX 2M Seoul XP APAN Tokyo XP 8M 2M 45M STAR TAP ATM ATM/SONET 155Mbps/310Mbps ATM/SONET 622Mbps
NLANR/MNA Measurement and Network Analysis Hans-Werner Braun Ronn Ritke NLANR/MNA (UCSD/SDSC) http://moat.nlanr.net/ Funded by the National Science Foundation/CISE/ANIR
Goals and objectives • Creation of the Network Analysis Infrastructure (NAI) to support measurements and network analysis • Network measurement and analysis research activities • Tool development for analysis and visualizations • All data, analyses, graphs, visualizations, and tools are made public available for use by all researchers.
Passive Measurement and Analysis (PMA) project (Passive traffic collection and analysis at optical carrier speeds) • Completely noninvasive, no impact on forwarding paths. • Aggregated traffic signature at a measurement point. • OC3/OC12, ATM and POS, OC48 (develop OC192 capability). • Between June 2000 and Jan 2001 (7 months) 6,000 PMA trace files were downloaded (31 per day) from at least 193 different sites. • Trace analysis summaries include (total packets, Bytes, top port numbers by volume, top 100 throughput connections, etc.)
Passive measurement deployment status U. of Michigan Michigan State U. STARTAP/APAN NCAR U. Colorado, Boulder Argonne Nat. Lab Ohio State U. Columbia U. Front Range GigaPoP NCSA Colorado State FIX-West Indiana State Old Dominion U. AIX/MAE-West NASA-Ames MCNC North Carolina State U. U. of North Carolina Duke U. U. Memphis SDSC, U. California, San Diego Texas GigaPoP Tel Aviv U. (I-2) Rice U. Baylor College of Medicine U. of Houston Texas A&M U. U. of Florida Miami U. Florida State U. FDDI OC3 ATM OC3 PoS OC12 ATM OC12 PoS 26 September 2000
Active Measurement Project (AMP) • Led by Tony McGregor • Focus on site-to-site measurement across high performance networks • Attempt to deploy FreeBSD-based AMP machines at all HPC sites • about 130 machines currently deployed and operational • RTT, topology, and loss; user/event driven throughput • We currently measure RTT to each of the other monitors every minute and the route to each every 10 minutes
Active measurement deployment status UAlaska Washington State U. UWashington Oregon State Montana State MTU UVermont NDSU UWisc- Milwaukee UOregon UWisc MSU SDSMT Dartmouth URochester Startap WSU Iowa State UIowa NTNU MIT NWU UMass BU UWyoming UMich UIC PSU UConn Harvard FNAL Columbia Yale ColoState NCSA CMU/PSC UDel UPenn NCAR UIUC UMBC Princeton IU WVU JHU ACCESS UCBoulder Kansas State UMd UC NSF UMissouri GMU Georgetown UCB UofUtah UKansas UVirginia ODU Stanford SLAC Oklahoma State WUSTL UCSC NCREN/NCSC UTK Vanderbilt UofOklahoma UNC-CH Duke UCLA CSU-SB NCSU ASU GATech UC-Irvine UNM UAH CSUPomona Mississippi State UofGeorgia SDSC UArizona UCSD Emory U. SMU UAB SDSU NMSU UA FSU Rice UFlorida UHawaii UCF USF UMiami UWaikato 23 February 2000
International Collaborations • Discussions with Tom DeFanti have included the monitoring of STAR LIGHT, and early insertion of optical splitters to allow quick installation of PMA machines. • We are in talks with AMPATH regarding the placement of an OCXmon and AMP machine to measure the traffic from AMPATH. • I recently attended a meeting in Russia with Greg Cole of NaukaNet (formerly Fastnet) and are discussing several possible measurement activities.
International Collaborations (Cont’d) • We have a PMA monitor in Israel, and AMP machines in Korea, Norway, Australia, and New Zealand (soon Japan). • We are working with Canada, Korea, and Australia to help them install their own local AMP meshes. • We are working with the Pacific Rim Applications & Grid Middleware Assembly (PRAGMA) effort at SDSC. • Interest has also been expressed by other countries (Japan, China and Thailand) in both the AMP and PMA projects.
Pusan Taegu Kwangju Taejon Seoul Suwon HPCnet Renater 2 SingAREN HPCnet HPCnet HPCnet HPCnet KOREA Network Map : ~2001 KIX 2M Seoul XP APAN Tokyo XP 8M 2M 45M STAR TAP ATM ATM/SONET 155Mbps/310Mbps ATM/SONET 622Mbps
AARNet’s International ConnectionsCurrent and Planned CANet APAN Seattle StarTap Japan Europe Abilene GEANT SLO Hawaii Taiwan South America Singapore PNG International Transit Network South Asia Middle East Europe Fiji AARNet Sydney Global GRID Forum Perth New Zealand
Possible CA*net 4 Topology January 1, 2002 Edmonton Prince George Saskatoon Winnipeg Vancouver Calgary Regina Halifax Thunder Bay Kamloops St. John's Victoria Quebec City Charlottetown Spokane Sudbury Seattle Montreal Ottawa Fredericton Halifax CA*net 4 Node Mini-IX Minneapolis Toronto Kingston Buffalo London Possible Future Breakout Albany Hamilton Windsor Possible Future link or Option Chicago CA*net 4 OC192 New York