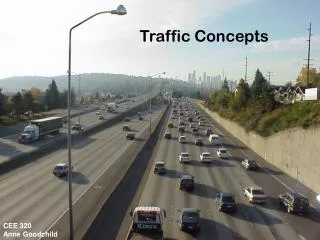
Traffic Capacity Analysis Concepts
Traffic Capacity Analysis Concepts. Traffic Capacity. One of the most critical issues in traffic engineering : How much traffic a given facility can accommodate and under what operating conditions…. Capacity Analysis.

Traffic Capacity Analysis Concepts
E N D
Presentation Transcript
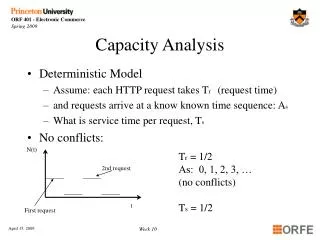
Traffic Capacity • One of the most critical issues in traffic engineering : How much traffic a given facility can accommodate and under what operating conditions…
Capacity Analysis • A set of analytic models that relate flow levels, geometric characteristics, and controls to measures of the resulting operating capacity • Standard reference for capacity analysis procedures: Highway Capacity Manual (HCM)
Capacity • HCM “ the maximum hourly rate at which persons or vehicles can be reasonably expected to traverse a point or uniform segment of a lane or roadway during a given time period under prevailing roadway and traffic conditions” • Different for different facilities (freeway, multilane, 2-lane rural, signals)
Roadway Characteristics • Roadway characteristics are the geometric characteristics of the freeway segment under study; these include the number and width of lanes, lateral clearances at the roadside and median, free-flow speeds, grades, and lane configuration.
Traffic Conditions • Any characteristics of the traffic stream that affects capacity or operations. These include the percentage composition of the traffic stream by vehicle type and driver characteristics such as the differences between weekday commuters (familiar drivers) and recreational drivers (unfamiliar drivers).
Control Conditions • Control conditions apply primarily to surface facilities, and most often refer to signals at individual intersections and on arterials. Controls affecting capacity also include STOP signs and lane use controls.
Capacity Values for Ideal Conditions 1) Multilane Uninterrupted Flow: refers to freeways and to sections of rural and suburban multilane highways between signalized intersections, where signal spacing is sufficient to allow for uninterrupted flow.
Capacity Values for Ideal Conditions 2) Two-lane Highways: They are unique among uninterrupted flow facilities. Since passing takes place in the opposing lane, traffic in one direction affects the traffic in the other. For 2-lane rural highways, capacity is expressed in terms of total two directional flow
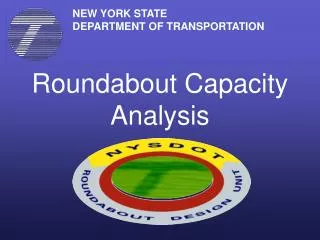
Capacity Values for Ideal Conditions 3) Interrupted Flow: Signalized intersections represent the most severe capacity restrictions. -Signal timing effects the capacity of a given lane
Freeways: Capacity (Free-Flow Speed) 2,400 pcphpl (70 mph) 2,350 pcphpl (65 mph) 2,300 pcphpl (60 mph) 2,250 pcphpl (55 mph) Multilane Suburban/Rural 2,200 pcphpl (60 mph) 2,100 pcphpl(55 mph) 2,000 pcphpl(50 mph) 1,900 pcphpl(45 mph) 2-lane rural – 2,800 pcph Signal – 1,900 pcphgpl Ideal Capacity
Volume vs Flow Rate • Volume • Frequency of vehicles during a time period • Flow Rate • Vehicles/ 15 min expanded to 1 hour
Volume vs Flow Rate TimeVolumeFlow Rate 0 – 15 min150 vehs600 vph 15 – 30200800 30 – 453001200 45 – 602501000
Service volume Peak Hour Factor (PHF) • Ratio of total hourly volume to the maximum 15-min rate of flow. PHF= Hourly volume/ peak rate of flow (within the hour) If 15-min periods are used, PHF= V/ 4*V15 PHF=the peak hour factor V= volume in vph V15= volume during the peak 15 min of the peak hour
Range of PHF 0.25 ≤ PHF ≤ 1.00 • 0.25 represents an extremely peaked distribution since all traffic occurs within 15 minute period. • 1.00 represents a uniform distribution of traffic throughout the hour.
Volume/Capacity Ratio (v/c) • Proportion of the facility’s capacity being utilized by current or projected traffic. v/c= rate of flow/capacity • The actual rate of flow can never be greater than capacity • For forecasting, v/c above 1.0 predicts that the facility will fail.. queues and extensive delays
Level of Service (LOS) • Chief measure of “quality of service” • Describes operational conditions within a traffic stream and their perception by motorists and/or passengers. • Does not include safety • Different measures for different facilities
Primary Measures for LOS in HCM • Speed and travel time • Density: It describes the proximity of other vehicles in the traffic stream. It is a surrogate measure for driver comfort and ease, and for the ability to maneuver within the traffic stream. • Delay: It is a generic term describing excess or unexpected time spent in travel.
Level of Service (LOS) • Six measures (A through F) • Freeway LOS • Based on traffic density (pc/mi/lane)
LOS A Free-flow operation LOS B Reasonably free flow Ability to maneuver is only slightly restricted Effects of minor incidents still easily absorbed Levels of Service
LOS C Speeds at or near FFS Freedom to maneuver is noticeably restricted Queues may form behind any significant blockage LOS D Speeds decline slightly with increasing flows Density increases more quickly Freedom to maneuver is more noticeably limited Minor incidents create queuing Levels of Service
LOS E Operation near or at capacity No usable gaps in the traffic stream Any disruption causes queuing LOS F Breakdown in flow Queues form behind breakdown points Demand > capacity Levels of Service
Service Flow Rates and Service Volumes SVi= SFi*PHF SVi = service volume for level of service i, vph Service volume is the max. full hour volume that can be accomodated w/o violating the defined operating limits of that level during the worst 15-min of the hour SFi=service flow rate for level of service i, vph The service flow rate for a given LOS is the max. rate of flow that can be sustained w/o violating the defined operating limits of that level PHF= peak hour factor
Adjusting Capacity and Service Flow Rate to Reflect Prevailing Conditions... c=cl*f1*f2*f3*......*fi where, c= capacity of facility under prevailing conditions, vph (alternatively SF) cl=capacity of facility under ideal conditions, pcph (taken from a table or figure) (alternatively MSF) fi= multiplicative adjustment factor for prevailing condition i
Prevailing Conditions • Geometric Conditions • Horizontal and vertical alignment • Lane width and lateral clearance • Grades • Traffic Conditions • Directional distribution • Heavy vehicles in the traffic stream
Prevailing Conditions • Control Factors • Speed limits • Lane use controls • Traffic signals • Stop and yield
Capacity Analysis for Uninterrupted Flow • A class of highway facilities on which there are no external interruptions to traffic stream. • No external causes: at-grade driveways & intersections, traffic signals, STOP or YIELD signs • Freeway is the only type of facility that provides completely uninterrupted flow
Definitions- Free Flow Speed • Free-Flow Speed (FFS) • Theoretical speed when density and flow are zero • Factors affecting free-flow speed • Lane width • Lateral clearance • Number of lanes • Interchange density • Geometric design
Design Hourly Volume (DHV) Design Hourly Volume is the one hour period in the design year selected for determining the highway design. • too expensive to design for the highest peak hour volume of the year • inadequate to design for the average hourly volume of the year • selected DHV should not be exceeded very often nor by very much
Directional Distribution • Directional Distribution is the predominant one-way traffic volume expressed as a percentage of two-way traffic. • Directional Design Hourly Volume (DDHV)