Download
1 / 19
190 likes | 274 Vues
Explore the evolution of fat availability in the U.S. food supply from 1909-1999 and its potential impact on health, with a focus on essential fatty acids and eicosanoid responses.

E N D
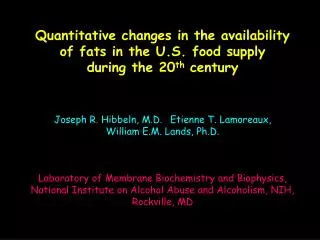
Quantitative changes in the availability of fats in the U.S. food supply during the 20th century Joseph R. Hibbeln, M.D. Etienne T. Lamoreaux, William E.M. Lands, Ph.D. Laboratory of Membrane Biochemistry and Biophysics, National Institute on Alcohol Abuse and Alcoholism, NIH, Rockville, MD
Quantitative Estimation of Nutrients Available for Consumptionin the U.S. Food Supply in each year, 1909-1999 U.S. Department of Agriculture’s Center for Nutrition Policy and Promotion prepared food and nutrient availability data, the only continuous source of U.S. food and nutrient availability extending back to 1909.The Economic Research Service of the USDA provided the amounts of 987 foods available for consumption based on disappearance. Disappearance =(Production+imports+starting stocks) -(Exports+industrial use+end stocks)The nutrient content of each food: the Standard Nutrient Database SR 13, Agricultural Research Service, Nutrient Data Laboratory, USDA. Nutrient compositions were adjusted throughout the century to reflect known changes
Amount of each nutrient available for consumption /y/person=(amount of each of 987 foods available for consumption) X(nutrient content of that food in that year) by the population of the U.S. for that year
Estimated tissue concentrations of arachidonic acid (+20:3n-6) - Population averages -
X X X X = Actual tissue measures X Estimated tissue availability of n-6 eicosanoid precursors, (20:4n-6+20:3n-6, % PL-HUFA) Based on foods available for consumption in the U.S. 1909-1999
1999 - 25 lbs/person/y lbs/person/y 1909 - 0.02 lbs/person/y
One interesting question is whether the change in linoleic acid over the last 100 years correlates with changes in the prevalence rates of major depression in the same time period The next slide describes the correlations between changing cumulative rates of major depression at each age estimated from the ECA data and the linolenic acid (en%) available for consumption in the food supply.
Increases in cumulative rates of major depression during the 20th century and increased linoleic acid (en%) in the U.S. food supply. 0.10 Age 35 r = 0.999 F= 268 p<0.00001 Age 45 r = 0.994 F= 286 p<0.0007 0.08 Age 25 r = 0.978 F= 89 p<0.0007 0.06 1985 Cumulative rates of depression 0.04 1975 0.02 1965 1955 0.00 1945 1935 1925 -0.02 2 3 4 5 6 7 8 Linoleic acid, energy % of all foods available for consumption Hibbeln et al 2002, unpublished
Convert your food choices into your tissue essential fatty acid composition and the intensity of your n-6 eicosanoid responses • http:ods.od.nih.gov/eicosanoids • www.nagoya-cu.ac.jp/eicosanoids
Essential Fats: Metabolism and Dietary Sources Canola oil Walnuts Safflower oil Corn oil Soy bean oil Flax seed Leaf plants 20:5n-3, eicosapentaenoicacid, 20:4n-6, arachidonic acid EPA AA Fish Meat, Seafood Organs Seaweed Series 2 Series 3 Prostaglandins Prostaglandins Thromboxanes Thromboxanes Series 4 Series 5 Leukotrienes Leukotrienes 22:6n-3, docosahexaenoic acid, DHA platelet activity (brain, retina, testis) immune responses smooth muscle many other functions Omega-3 Omega-6 O O O O C- OH C- OH C- OH 18:2n6 linoleic acid, LA 18:3n3 linolenic acid, LNA competition for D6 and D5 desaturase and elongation enzymes O O C- OH C- OH O O O C- OH C- OH C- OH