Volatility INDEX (VIX)
310 likes | 672 Vues
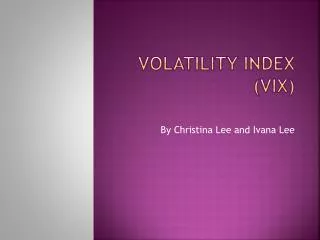
Volatility INDEX (VIX). By Christina Lee and Ivana Lee. What is volatility?. Volatility is the rate at which the price of a certain security (stocks, bonds, options, etc.) moves.

Volatility INDEX (VIX)
E N D
Presentation Transcript
Volatility INDEX (VIX) By Christina Lee and Ivana Lee
What is volatility? • Volatility is the rate at which the price of a certain security (stocks, bonds, options, etc.) moves. • It is used to measure risk: the higher the volatility, the bigger the fluctuations in price. The lower the volatility, the smaller the fluctuations in price. • In other words, the more quickly a price changes up and down, the more “volatile” it is. • Volatility is based on past data, while implied volatility represents expectations about future fluctuations.
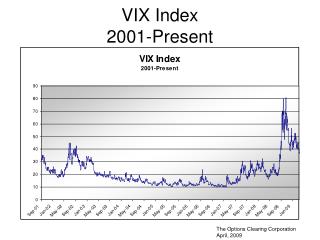
We will be explaining what VIX is and is not, why it was created, what causes it to move, and why it should be viewed as an important piece of market information for investors. objective Basic Chart of VIX with a range of 1 year from finance.yahoo.com
What is the vix? • It is calculated by the Chicago Board Options Exchange. • The VIX measures the implied volatility of the S&P 500 index options over the next 30 days, and is then annualized. It represents the investor’s expectations on how much the index may fluctuate in the future. • Differs from the Dow Jones Index Average (DJIA) because it measures volatility and not price. • It is also known as the “fear index” because a high VIX represents uncertainty about future prices.
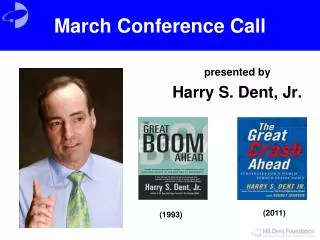
Brief history • The VIX was created by Professor Robert Whaley in 1993. • It was originally based on the S&P 100 index option prices. At the time it was created, the S&P 100 options were the most actively traded options in the US, making up about ¾ of the entire index option volume. • Since 2003, the VIX has been based on the S&P 500 index because these options now trade more frequently than the S&P 100 options.
Benefit of an Index • What do you think is more important? • The process taken to calculate the current level. • The interpretation of a given level comparing it to a past time interval. • ANSWER: Most people tend to work on the latter by relating the information to their portfolio. • The real benefit from an index: compares current level to some historical benchmark
Vix Movements • VIX frequently spikes upward in response to unexpected market and world events. • Market crash in October 1987 which was the worst stock market crash since the Great Depression (Black Monday) • October 1998 spike occurred during a period of general nervousness in the stock market. • Financial Crisis of October 2008.
More on VIX Movements • The VIX usually ends up returning to normal levels after a spike. • Appears to spike in opposite directions. • There are also times when a run-up in stock prices is accompanied by a run-up in volatility • Investors become nervous even during market advances.
Simple understanding of the volatility index • Since VIX spike during periods of market turmoil, it is known to be the “investor fear gauge.” • If expected market volatility increases, investors demand higher rate of return on stocks, so stock prices fall. • Previous statement suggests that the relation between the rate of change in the VIX should be proportional to the rate of return on the S&P 500 Index. • The relation is much more complicated.
How to calculate the vix • To calculate the VIX, we use the formula:
Calculating “t” • The time to expiration, T, is broken down into minutes in order to be as precise as possible: • T = {MCurrent day + MSettlement day + MOther days}/ Minutes in a year WHERE: • MCurrent day = minutes remaining until midnight of the current day • MSettlement day = minutes from midnight until 8:30 a.m. on settlement day • MOther days = total minutes in the days between current day and settlement day • Example: Let’s say it is 8:30AM and the settlement date is 9 days away: T = {930 + 510 + 11,520) / 525,600 = 0.0246575
Calculating “f” • First, we must find the strike price at which the absolute difference between the call and put prices is the lowest. According to the table below, the difference between the call and put prices is lowest when the strike is 920.
Calculating “F” • After we find the lowest strike price and its corresponding values for the call and put prices, then we can use the following equation to solve for F: F = Strike Price + e^RT × (Call Price – Put Price) • Let’s say the riskless interest rate is 0.38%. And the In this example, we would plug in: F = 920 + e^(0.0038 × 0.0246575) × (37.15 – 36.65) = 920.50005
How to calculate the vix • To calculate the VIX, we use the formula:
how the vix calculates implied volatilities • Example: If the VIX is 15, this means that the expected annualized change for the next 30 days is 15%. So, we can expect the S&P 500 to move up or down over the next 30 days. • This means that there is a 68% chance (one standard deviation) that the S&P 500’s return for the next 30 days will increase or decrease by 4.33%.
Normal Range • The median daily closing level is 18.88. • Yesterday’s closing level was 19.08 which shows that the VIX is in the normal range. • How does VIX show significant events that largely affected the economy? • The widest range experiences occurred in the first 10 months of 2008 (between 18.16 and 63.31). • The second-widest range was in the year 1987 when the stock market crashed.
Making Predictions of Future Volatility • A common index, the Dow Jones Industrial Average (DJIA) only has meaning relative to its history. • An index that shows 30 large, publicly owned companies based in the United States. • The value of the DJIA is not the actual average of the prices of its component stocks, but rather the sum of the component prices divided by a divisor, which changes whenever one of the component stocks has a stock dividend. • VIX has a simple, probabilistic interpretation regarding the expected range of the rates of return on the S&P 500 index level over the next 30 days.
Works Cited • http://en.wikipedia.org/wiki/VIX • http://www.wikinvest.com/index/Volatility_Index_%28VIX%29 • http://www.cboe.com/micro/vix/vixwhite.pdf • http://understandingthemarket.com/?p=52 • autopiloto52forex.s3.amazonaws.com/5491888779215515.pdf • http://hnn.us/articles/895.html • http://en.wikipedia.org/wiki/Dow_Jones_Industrial_Average • http://en.wikipedia.org/wiki/Stock_market_crash#October_19.2C_1987