Queueing Theory
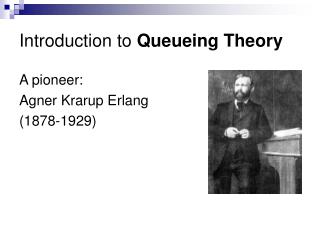
Queueing Theory. Frank Y. S. Lin Information Management Dept. National Taiwan University yslin@im.ntu.edu.tw. References. Leonard Kleinrock, “ Queueing Systems Volume I: Theory ”, New York: Wiley, 1975-1976.


Queueing Theory
E N D
Presentation Transcript
Queueing Theory Frank Y. S. Lin Information Management Dept. National Taiwan University yslin@im.ntu.edu.tw
References • Leonard Kleinrock, “Queueing Systems Volume I: Theory”, New York: Wiley, 1975-1976. • D. Gross and C. M. Harris, “Fundamentals of Queueing Theory”, New York: Wiley, 1998.
Agenda • Introduction • Stochastic Process • General Concepts • M/M/1 Model • M/M/1/K Model • Discouraged Arrivals • M/M/∞ and M/M/m Models • M/M/m/m Model
Queueing System • A queueing system can be described as customers arriving for service, waiting for service if it is not immediate, and if having waited for service, leaving the system after being served.
Why Queueing Theory • Performance Measurement • Average waiting time of customer / distribution of waiting time. • Average number of customers in the system / distribution of queue length / current work backlog. • Measurement of the idle time of server / length of an idle period. • Measurement of the busy time of server / length of a busy period. • System utilization.
Why Queueing Theory (cont’d) • Delay Analysis Network Delay = Queueing Delay + Propagation Delay (depends on the distance) + Node Delay Processing Delay (independent of packet length, e.g. header CRC check) Adapter Delay (constant)
Characteristics of Queueing Process • Arrival Pattern of Customers • Probability distribution • Patient / impatient (balked) arrival • Stationary / nonstationary • Service Patterns • Probability distribution • State dependent / independent service • Stationary / nonstationary
Characteristics of Queueing Process (cont’d) • Queueing Disciplines • First come, first served (FCFS) • Last come, first served (LCFS) • Random selection for service (RSS) • Priority queue • Preemptive / nonpreemptive • System Capacity • Finite / infinite waiting room.
Characteristics of Queueing Process (cont’d) • Number of Service Channels • Single channel / multiple channels • Single queue / multiple queues • Stages of Service • Single stage (e.g. hair-styling salon) • Multiple stages (e.g. manufacturing process) • Process recycling or feedback
Notation • A queueing process is described by A/B/X/Y/Z
Notation (cont’d) • For example, M/D/2/∞/FCFS indicates a queueing process with exponential inter-arrival time, deterministic service times, two parallel servers, infinite capacity, and first-come, first-served queueing discipline. • Y and Z can be omitted if Y = ∞ and Z = FCFS.
Stochastic Process • Stochastic process: any collection of random variables Χ(t), tT, on a common probability space where t is a subset of time. • Continuous / discrete time stochastic process • Example: Χ(t) denotes the temperature in the class on t = 7:00, 8:00, 9:00, 10:00, … (discrete time) • We can regard a stochastic process as a family of random variables which are “indexed” by time. • For a random process X(t), the PDF is denoted by FX(x;t) = P[X(t) <= x]
Some Classifications of Stochastic Process • Stationary Processes: independent of time FX(x; t + τ) = FX(x; t) • Independent Processes: independent variables FX(x; t) = FX1,…, Xn(x1,…, xn ; t1,…,tn) = FX1(x1; t1) …FXn(xn; tn) • Markov Processes: the probability of the next state depends only upon the current state and not upon any previous states. P[X(tn+1) = xn+1 | X(tn) = xn, …., X(t1) = x1] = P[X(tn+1) = xn+1 | X(tn) = xn]
Some Classifications of Stochastic Process (cont’d) • Birth-death Processes: state transitions take place between neighboring states only. • Random Walks: the next position the process occupies is equal to the previous position plus a random variable whose value is drawn independently from an arbitrary distribution.
Continuous-time Memoryless Property If X ~Exp(λ), for any a,b > 0, P[X > a + b | X > a] = P[X > b] Proof: P[X > a + b | X > a]
Global Balance Equation • Define Pi = P[system is in state i] Pij = P[get into state j right after leaving state i] rate out of state j = rate into state j
General Balance Equation • Define S = a subset of the state space S j rate in = rate out
General Equilibrium Solution • Notation: • Pk= the probability that the system contains k customers (in state k) • λk= the arrival rate of customers when the system is in state k. • μk= the service rate when the system is in state k.
General Equilibrium Solution (cont’d) • Consider state k: λk λk-1 k-1 k k+1 μk μk+1 . . . #
Little’s Result • = average number of customers in the system • T = system time (service time + queueing time) • λ= arrival rate Black box Service time … Queueing time System time T
M/M/1 Model Single Server, Single Queue (The Classical Queueing System)
M/M/1 Queue • Single server, single queue, infinite population: • Interarrival time distribution: • Service time distribution • Stability condition λ < μ
rate out rate in M/M/1 Queue (cont’d) • System utilization • Define state Sn = n customers in the system (n-1in the queue and 1 in service) S0 = empty system S
M/M/1 Queue (cont’d) • Define pn = P[n customers in the system] (rate in = rate out) Since #
M/M/1 Queue (cont’d) • Average number of customers in the system #
M/M/1 Queue (cont’d) • Average system time • P[≧ k customers in the system] (Little’s Result) #
M/M/1/K Model Single Server, Finite Storage
M/M/1/K Model • The system can hold at most a total of K customers (including the customer in service) λk = λ if k < K 0 if kK μk = μ
Discouraged Arrivals • Arrivals tend to get discouraged when more and more people are present in the system.
M/M/∞ and M/M/m M/M/∞ - Infinite Servers, Single Queue (Responsive Servers) M/M/m - Multiple Servers, Single Queue (The m-Server Case)
M/M/∞ Queue • There is always a new server available for each arriving customer.
M/M/∞ Queue (cont’d) (Little’s Result)
M/M/m Queue • The M/M/m queue • An M/M/m queue is shorthand for a single queue served by multiple servers. • Suppose there are m servers waiting for a single line. For each server, the waiting time for a queue is a system with service rateμ and arrival rate λ/m. • The M/M/1 analysis has been done, at risk conclusion: delay = throughput
M/M/m Queue (cont’d) λk = λ μk = kμ if km mμ if k > m For km For k > m
M/M/n Queue (cont’d) ∴ P[queueing] = Total system time =
Comparisons (cont’d) • M/M/1 v.s M/M/4 If we have 4 M/M/1 systems: 4 parallel communication links that can each handle 50 pps (μ), arrival rate λ = 25 pps per queue. average delay = 40 ms. Whereas for an M/M/4 system, average delay = 21.7 ms.
Comparisons (cont’d) • Fast Server v.s A Set of Slow Servers #1 If we have an M/M/4 system with service rate μ=50 pps for each server, and another M/M/1 system with service rate 4μ = 200 pps. Both arrival rate is λ = 100 pps delay for M/M/4 = 21.7 ms delay for M/M/1 = 10 ms
μ μ μ λ λ λ nμ nλ Comparisons (cont’d) • Fast Server v.s A Set of Slow Servers #2 If we have nM/M/1 system with service rate μ pps for each server, and another M/M/1 system with service rate nμ pps. Both arrival rate is nλ pps S1 S2 …
M/M/m/m Multiple Servers, No Storage (m-Server Loss Systems)
M/M/m/m • There are available m servers, each newly arriving customers is given a server, if a customers arrives when all servers are occupied, that customer is lost e.g. telephonysystem.
M/M/m/m (cont’d) • Let pm describes the fraction of time that all m servers are busy. The name given to this probability expression is Erlang’s loss formula and is given by • This equation is also referred to as Erlang’s B formula and is commonly denoted by B(m,λ/μ) • http://www.erlang.com