
Project Background
E N D
Presentation Transcript
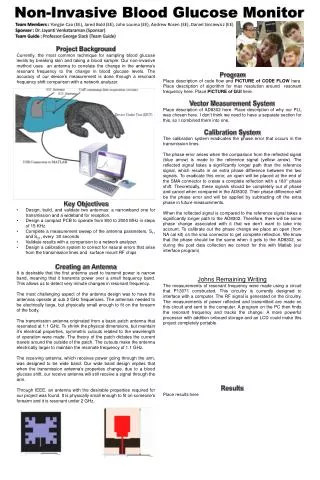
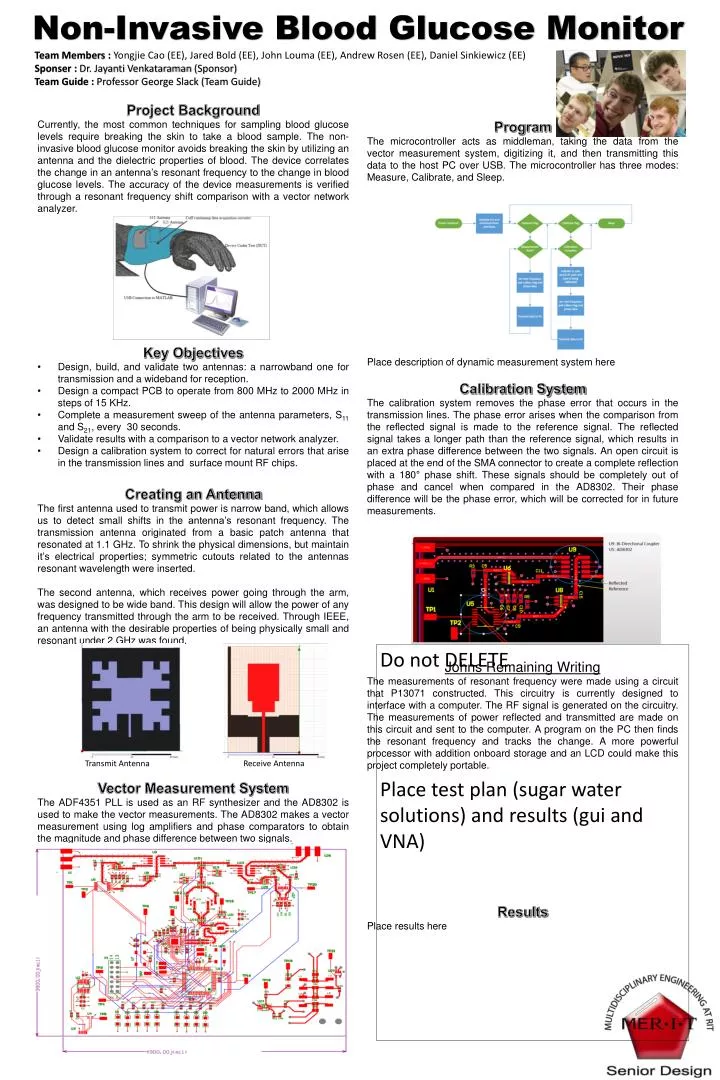
Non-Invasive Blood Glucose Monitor Team Members : Yongjie Cao (EE), Jared Bold (EE), John Louma (EE), Andrew Rosen (EE), Daniel Sinkiewicz (EE) Sponser : Dr. JayantiVenkataraman (Sponsor) Team Guide : Professor George Slack (Team Guide) • Project Background • Currently, the most common techniques for sampling blood glucose levels require breaking the skin to take a blood sample. The non-invasive blood glucose monitor avoids breaking the skin by utilizing an antenna and the dielectric properties of blood. The device correlates the change in an antenna’s resonant frequency to the change in blood glucose levels. The accuracy of the device measurements is verified through a resonant frequency shift comparison with a vector network analyzer. • Key Objectives • Design, build, and validate two antennas: a narrowband one for transmission and a wideband for reception. • Design a compact PCB to operate from 800 MHz to 2000 MHz in steps of 15 KHz. • Complete a measurement sweep of the antenna parameters, S11 and S21, every 30 seconds. • Validate results with a comparison to a vector network analyzer. • Design a calibration system to correct for natural errors that arise in the transmission lines and surface mount RF chips. • Creating an Antenna • The first antenna used to transmit power is narrow band, which allows us to detect small shifts in the antenna’s resonant frequency.The transmission antenna originated from a basic patch antenna that resonated at 1.1 GHz. To shrink the physical dimensions, but maintain it’s electrical properties; symmetric cutouts related to the antennas resonant wavelength were inserted. • The second antenna, which receives power going through the arm, was designed to be wide band. This design will allow the power of any frequency transmitted through the arm to be received. Through IEEE, an antenna with the desirable properties of being physically small and resonant under 2 GHz was found. • Transmit Antenna Receive Antenna • Vector Measurement System • The ADF4351 PLL is used as an RF synthesizer and the AD8302 is used to make the vector measurements. The AD8302 makes a vector measurement using log amplifiers and phase comparators to obtain the magnitude and phase difference between two signals. • Program • The microcontroller acts as middleman, taking the data from the vector measurement system, digitizing it, and then transmitting this data to the host PC over USB. The microcontroller has three modes: Measure, Calibrate, and Sleep. • Place description of dynamic measurement system here • Calibration System • The calibration system removes the phase error that occurs in the transmission lines. The phase error arises when the comparison from the reflected signal is made to the reference signal. The reflected signal takes a longer path than the reference signal, which results in an extra phase difference between the two signals. An open circuit is placed at the end of the SMA connector to create a complete reflection with a 180° phase shift. These signals should be completely out of phase and cancel when compared in the AD8302. Their phase difference will be the phase error, which will be corrected for in future measurements. • Johns Remaining Writing • The measurements of resonant frequency were made using a circuit that P13071 constructed. This circuitry is currently designed to interface with a computer. The RF signal is generated on the circuitry. The measurements of power reflected and transmitted are made on this circuit and sent to the computer. A program on the PC then finds the resonant frequency and tracks the change. A more powerful processor with addition onboard storage and an LCD could make this project completely portable. • Results • Place results here Do not DELETE Place test plan (sugar water solutions) and results (gui and VNA)