
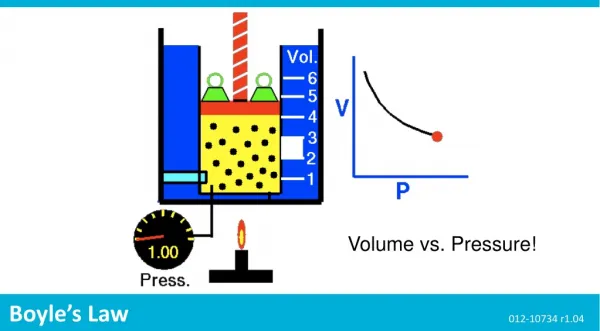
Volume vs. Pressure!
Volume vs. Pressure!. Boyle’s Law. 012-10734 r1.04. Boyle’s Law. Introduction. Each page of this lab that contains the symbol

Volume vs. Pressure!
E N D
Presentation Transcript
Volume vs. Pressure! Boyle’s Law 012-10734 r1.04
Boyle’s Law Introduction Each page of this lab that contains the symbol should be inserted into your journal. After completing a lab page with the snapshot symbol, tap (in the upper right hand corner) to insert the page into your journal. Journals and Snapshots The Snapshot button is used to capture the screen. The Journal is where snapshots are stored and viewed. The Share button is used to export or print your journal to turn in your work. Note: You may want to take a snapshot of the first page of this lab as a cover page for your Journal.
Boyle’s Law Lab Challenge Determine the effect of volume on the pressure of a closed system containing a fixed amount of molecules at a constant temperature. What would happen to the pressure inside the exercise ball if you decreased its volume by sitting on it? A sealed exercise ball contains a fixed amount of gas molecules at a fixed temperature.
Boyle’s Law Background • Solids and liquids take up a fixed amount of space. The volume of gases, however, can change. • Gas molecules can be compressed into smaller volumes and when released into larger volumes the gas molecules will spread out and fill all the available space.
Boyle’s Law Self-Check _____________ molecules can be compressed into smaller volumes. Solid Liquid Gas Solid, liquid, and gas
Boyle’s Law ...Background • The ability of gases to change the amount of space they occupy is explained by the kinetic molecular theory of gases. • The kinetic molecular theory of gases explains that: • gas particles are small hard spheres that are so far apart that their volume can be considered zero. • gas particles move in straight lines until they collide with another particle or surface forcing them to change direction. • the movement of gases is random and their collisions are considered elastic because they do not gain or lose energy when they collide. KEi = KEf
Boyle’s Law Self-Check • According to the kinetic molecular theory, gas molecules are positioned so far apart that their volume is considered to occupy __________ of their container. • 70% • 50% • 30% • 0% Gas molecules
Boyle’s Law ...Background • A gas that behaves according to these assumptions is considered an ideal gas. Although there is no such thing as an ideal gas, at many conditions of temperature and pressure, real gases behave ideally. • Ideal gases follow many laws including Boyle's law. Boyle's law describes the relationship between the pressure Pof a gas and the volume V it occupies (at constant temperature). Force 2 N Area 100 mL 500 mL Pressure is the average force spread over an area. Gas molecules exert pressure when they collide with their container. Volume is the space matter occupies.
Boyle’s Law Safety: • Follow all common laboratory safety procedures. • Avoid over-compressing the air in thesyringe to minimize the risk of injury or damage to the equipment.
Boyle’s Law Materials and Equipment: Collect all of these materials before beginning the lab. • Absolute pressure sensor • Sensor extension cable • Syringe, 20-mL or 60-mL • Tubing, 1- to 2-cm • Quick-release connector • Glycerin, 2 drops Glycerin
Boyle’s Law Sequencing Challenge The steps to the left are part of the procedure for this lab activity. They are not in the right order. Determine the correct sequence of the steps, then take a snapshot of this page. A. Connect a syringe with 20 mL of air in it to the absolute pressure sensor. B. Calculate the average pressure at each volume and use them to determine the relationship between P and V. C. Record the absolute pressure Pat 20 mL, 18 mL, 16 mL, 14 mL, 12 mL, 10 mL, 8 mL, and 6 mL. D. Collect two additional sets of absolute pressure data at each volume V.
Boyle’s Law Prediction Q1:What will happen to the pressure in the syringe as the volume decreases? Draw your prediction on the graph provided.* *To Draw a Prediction: 1. Tap to open the tool palette. 2. Tap then use your finger to draw your prediction. 3. Tap when finished. 4. If you make a mistake, tap to clear your prediction.
Boyle’s Law Setup • Connect the absolute pressure sensor to the data collection system using the sensor extension cable. Absolute pressure sensor Extension cable
Boyle’s Law Setup Q2:What is the independent variable in this experiment? What units will it be measured in? • Connect the syringe to the quick-release connector using a piece of tubing. Put a drop of glycerin on the connecting pieces as necessary. Syringe Tubing, 1-2 cm Quick-release connector Glycerin drop Glycerin drop
Boyle’s Law Setup Q3:What is the dependent variable in this experiment? What units will it be measured in? • Withdraw the plunger until there is 20 mL of air in the syringe. • Insert the quick-release connector into the port of the absolute pressure sensor and then turn the connector clockwise until the fitting “clicks” (about one-eighth of a turn). Pressure port Quick-release connector
Boyle’s Law Procedure • Tap to start a data set. • Set the syringe volume to 20 mL. • When the pressure has stabilized, tap to record the pressure. • Repeat steps 2-3, but set the syringe volume to 18 mL, 16 mL, 14 mL, 12 mL, 10 mL, 8 mL and 6 mL. • Tap to stop the data set.
Boyle’s Law • Remove the syringe from the sensor using the quick-release connector. • Set the syringe plunger to 20 mLand re-connect the syringe to the sensor. • Tap to start the second data set. • Set the syringe volume to each volume listed and tap when the pressure stabilizes. • Tap to stop the data set.
Boyle’s Law Q4:Explain when and why it becomes difficult to depress the syringe. Q5:What is inside the syringe that is causing the pressure? Q6:Why is it important to collect multiple runs of data in an experiment?
Boyle’s Law • Remove the syringe from the sensor using the quick-release connector. • Set the syringe plunger to 20 mL and re-connect the syringe to the sensor. • Tap to start the third data set. • Set the syringe volume to each volume listed and tap when the pressure stabilizes. • Tap to stop the data set.
Boyle’s Law Data Analysis • Calculate the average pressure for each volume. Enter the average into the data table.* *To Enter Data into a Table: • Tapto open the tool palette. • Tap then tap a cell in the data table to highlight it in yellow. • Tap to open the Keyboard screen.
Boyle’s Law Data Analysis • Describe the overall trend seen in this graph. How can the relationship between pressure and volume be represented mathematically?
Boyle’s Law Data Analysis • Calculate the constant "k" for each run of data. Enter the constant into the data table.* P×V= k (Boyle's Law) *To Enter Data into a Table: • Tapto open the tool palette. • Tap then tap a cell in the data table to highlight it in yellow. • Tap to open the Keyboard screen.
Boyle’s Law Data Analysis • What is the constant "k" for air? Find the average of the average "k" values calculated at each volume.
Boyle’s Law Data Analysis • Create a best fit line (linear fit) of the constant "k" versus volume data.* *To Apply a Curve Fit: 1. Tapto open the tool palette. 2. Tapto open the Curve Fit screen. 3. Tap the name of the curve fit required.
Boyle’s Law Data Analysis • The graph on the previous page shows "k" versus volume. Note that for an "ideal gas" the value of "k" should be constant across all volumes. Does the gas tested in this lab act like an "ideal gas" at all volumes? Explain why or why not.
Boyle’s Law Analysis • Are pressure and volume directly proportional or inversely proportional? How do you know? Provide evidence from this lab.
Boyle’s Law Analysis 2a. What region of the pressure versus volume graph does air behave like an ideal gas? Like a real gas? 2b. What is the difference between an ideal gas and a real gas?
Boyle’s Law Analysis • Calculate the pressure you would expect at a cylinder volume of 15.0 mL. Show your work. Note:Tap to look in your journal for values determined earlier in the lab.
Boyle’s Law Synthesis • Explain why it is possible to write Boyle’s law as both PV = k and P1V1 = P2V2.
Boyle’s Law Synthesis • A helium balloon is released into the atmosphere. As it rises, atmospheric pressure decreases. • What do you expect will happen to the volume of the balloon? Why?
Boyle’s Law Synthesis • How could you change the experimental design to get results more consistent with an ideal gas?
Boyle’s Law Synthesis • A cylinder containing 250 mL of a gas has a pressure of 350 kPa. If the gas was compressed to a volume of 45 mL what would the pressure change to? Show your work. Hint:Use P1V1 = P2V2
Boyle’s Law Multiple Choice • At room temperature, air behaves like an ideal gas at _______________. • low pressures • high pressures • all pressures • air never behaves ideally
Boyle’s Law Multiple Choice • What condition will cause the volume of a gas to decrease? • an increase in the amount of gas • an increase in the temperature • an increase in pressure • a decrease in pressure
Boyle’s Law Multiple Choice • At a constant temperature the relationship between the volume Vof a gas and its pressure Pis ___________. • V = (constant)P • P = (constant)V • PV = constant • V/P = constant
Boyle’s Law Multiple Choice Evaporation of liquid nitrogen 4. Which graph shows the relationship between the pressure and volume of nitrogen gas at a constant temperature? A) B) C) D)
Boyle’s Law Multiple Choice • A gas contained in a 3.0 L cylinder has a pressure of 120 kPa. What will the new volume be if the pressure is increased to 240 kPa? • 1.5 L • 3.0 L • 4.5 L • 6.0 L
Boyle’s Law Congratulations! You have completed the lab. Please remember to follow your teacher's instructions for cleaning-up and submitting your lab.
Boyle’s Law References • All images were taken from PASCO documentation, public domain clip art, or Wikimedia Foundation Commons. • BOYLE'S LAW DIAGRAM: http://commons.wikimedia.org/wiki/Image:Boyles_Law_animated.gif • YOGA LADY http://www.freeclipartnow.com/recreation/sports/fitness/yoga.jpg.html • PURPLE BALLOON http://www.freeclipartnow.com/recreation/partying/balloon-purple-aj.jpg.html • HOT AIR BALLOON: http://www.openstockphotography.org/image-licensing/balloon/Hotairballoon- stockholm.jpg