Download
1 / 12
120 likes | 201 Vues
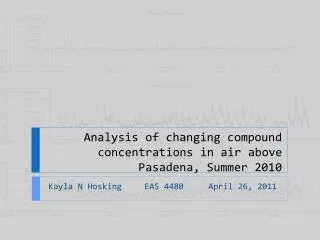
Analysis of changing compound concentrations in air above Pasadena, Summer 2010. Kayla N Hosking EAS 4480 April 26, 2011. Scientific Problem. There appears to be a significant shift in the mean value of the background concentrations of various species at a certain point during a study.

E N D
Analysis of changing compound concentrations in air above Pasadena, Summer 2010 Kayla N Hosking EAS 4480 April 26, 2011
Scientific Problem • There appears to be a significant shift in the mean value of the background concentrations of various species at a certain point during a study. • Is the difference of the means from before and after this point significant? For which species is it significant? • Are there similarities between the species that have a significant change/ similarities between the species that do not have a significant change? • From these groupings, is it possible to determine why the means shifted? Or why it happened when it did? • Because the change occurs at the same time across multiple species as seen from data collected by different groups of researchers in the study, it is assumed not to be purely error, and should have an explanation.
The Data: CalNex 2010 Study • Observation platform: • fixed in situ instruments at a ground site located on CalTech’s campus in Pasadena, CA • Sampling: • 0-D through time (time series measurements at a single site) • Sampling frequencies: vary depending on what is being measured • Sampling period: mid May – mid June 2010 • Uncertainties: vary depending on what is being measured
Data Analysis Methods • Univariate methods • Plotting the time series • Plotting the histograms • Statistical tests • Student’s t-test of means • Exploratory data analysis • Hypothesis: • There is a change in species background concentrations because there was a change in meteorological conditions. If this is true, there will be a statistically significant change in concentrations of various groups of compounds and in the met data. • Assumptions and support: • The data sets are normal distributions: see histograms
Results: Student’s t-test At the 99.9% confidence level (α = 0.001, p = α – 1 = 0.999) Precursors for Oxalate Primary Pollutants Secondary Organics
Results: Summary • Primary pollutants • Volatile • Carbon monoxide, CO • Nitrogen dioxide, NO2 • Particulate • Elemental carbon, EC • Hydrocarbon-like organic aerosols, HOA • Secondary organics • Organic Carbon, OC • Oxygenated organic aerosols, OOA • Water soluble organic carbon in the particulate phase, WSOCp • Oxalate precursors • Glyoxal, CHOCHO • Organic acids • Pyruvic acid • Formic acid, HCOOH • Biogenic volatile organic compounds (VOCs) • Isoprene • Methacrolein (MCAR) • MVK • Limonene Statistically significant changes at the 99.9% confidence level in the means of species from many different groups
Results: Student’s t-test At the 99.9% confidence level (α = 0.001, p = α – 1 = 0.999)
Results: Summary • Not significant at 99.9% confidence level • Relative Humility (%) • Wind Speed (m/s) • Wind Direction (°) • Solar Radiation (W/m2) • Significant at the 99.9% confidence level • Temperature (°C), with confidence interval [-2.7937, -1.9510] • Dew Point (°C), with confidence interval [-2.8605, -2.3400] • Pressure (mb), with confidence interval [0.5639, 0.9460] • Boundary Layer Height (m), with confidence interval [54.6894, 162.7789]
Results: Time Series Relative units normalized to maximums
Results: Histograms frequency Relative Humidity (%) Wind Speed (m/s) Wind Direction (°) Solar Radiation (W/m2)
Results: Time Series Relative units normalized to maximums
Results: Histograms frequency Temperature (°C) Dew Point (°C) Pressure (mb) Boundary Layer Height (m)