Finding Quadratic Models for Average Temperatures and Home Values
Learn how to create quadratic models using real-world data, such as average high temperatures in Charlotte, NC, and median home values in Connecticut. This guide covers defining variables, adjusting data to prevent model breakdown, choosing model types, and using the TI-84 calculator to graph and evaluate models. Discover how to write equations, check predictions against actual values, and estimate future data points. You'll also practice completing the square and factoring equations, ensuring you understand the fundamentals of quadratic modeling.

Finding Quadratic Models for Average Temperatures and Home Values
E N D
Presentation Transcript
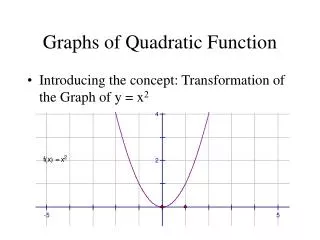
Quadratic Function Finding Quadratic models
Quadratic Models • Define Variables • Adjust data to prevent model breakdown • Draw scatter plot • Choose model type • Pick vertex and substitute into h and k • Pick another point to determine a • Write model • Check by graphing
Avg high temp in Charlotte, NC. • Find an equation for a model of these data • Using your model estimate the average high temperature during Dec • The actual avg high temp in Dec for Charlotte is 53 oF. How well does your model predict the value?
Determine the variables • Independent: • Time-m represents the months of the year. • m- also should start in a sequential manner to avoid model breakdown(a domain value that results in an output that does not make sense or makes an equation undefined mathematically) • Dependent: • T(m) represents the average high temperature in degrees Fahrenheit, for each month.
Adjusted Data and Plot • Utilizing the TI-84 enter the information into the L1 and L2 • Adjust the domain and range. x-min, x-max, y-min, and y-max • Graph on the calculator
Vertex • Determine the Vertex point. Which point looks like the max/min? Plug into the vertex equation: f(x) = a(x – h) + k where h, k and a are real numbers f(x) = a(x – 7) + 89 y-value x-value
Find a • Plug in another point on the curve into the equation. Pick a point (10, 72) T(m) = a (m – 7)2 + 89 72 = a(10 – 7)2 + 89 72 – 89 = a(3)2 -17 = 9a -1.89 = a
Write Model • T(m) = -2.25(m – 7)2 + 89 Graph the equation on the TI-84. STAT PLOT(Y=) plot enter the equation in Y1 Enter GRAPH Should see a curve that contains the point that were listed in LIST.
Use model to find Dec Temp • T(m) = -1.89(m– 7)2 + 89 T(m) = -1.89(12 – 7)2 + 89 T(m) =-1.89(5)2 + 89 T(m) =-1.89(25) + 89 T(m) = -47.25 + 89 T(m) = 41.75
Check Model • The actual high Temperature in Dec for Charlotte, NC is 53 oF. How well does the model predict value?
Adjusting a Model • Eyeball best fit test. • Enter the following information on the TI-84 f(x) = 4(x – 10)2– 12 Write the equation in Y= We either need to change a, x or h. The vertex seems fine, butaneeds adjustment try a smaller value for a.
Practice f(x) = -0.2(x +2)2 + 7 • Adjust the data
Quadratic Model The median home value in thousands of dollars for Connecticut. • Find an equation for a model of these data. • Use your model to estimate the median home value in 2009. • Give a reasonable Domain and Range.
Domain and Range • Domain will spread out beyond the given data • Range will have a maximum at the vertex and a minimum at 9
Solving Quadratic Equations • C) Factoring • D) Quadratic Equation
Square Root Property • Looking at the model for the Connecticut median home values we got: V(t) = -8(t – 6)2 + 307 Find when the median home values was $200,000 Find the horizontal intercepts and explain their meaning
Median Home Value • 200 = -8(t – 6)2 + 307 • 200 - 307 =-8(t – 6)2 • -107/-8=- 8(t – 6)2 /-8 • 13.375 = (t – 6)2 • (+/-)3.66 = t– 6 • 3.66 + 6 = t or –3.66 + 6 = t • 9.66 or 2.34 • About 2010 and 2002 median home prices were 200,000.
Y = 0 Horizontal Intercepts When the graph touches the x-axis 0 = -8 (t – 6)2 + 307 -307/-8 = -8 (t – 6)2 /-8 38.375 = (t – 6)2 (+/-)6.19= t – 6 6.19 + 6 = t -6.19 + 6 = t Represents model breakdown because median house price in 2000 and 2010 was $0.
Completing the Square x2– 12x + 11 = 0 x2– 12x + 36 = -11 + 36 (x– 6)2= 25 x– 6 = (+/-) 5 x = 5 +6 x = -5 + 6 x = 11 and 1
Completing the Square Practice • 2x2–16x– 4 = 0 • 4a2 + 50 = 20a
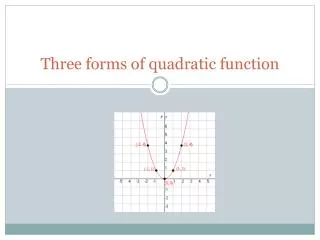
Factoring Equations • Standard Form f(x) = x2 + 8x + 15 • Factored Form f(x) = (x + 3)(x + 5)
Factoring • x2 + 3x - 50 = 38 • 3x2– 5x = 28
Practice Median home value in Gainesville, Florida, can be modeled by V(t) = -6.t2 + 84.4t–102.5 Where V(t) represents the median home value in thousands of dollars for Gainesville t years since 2000. In what year was the median home value $176,000?