Investigating Changes in Sub-Daily Rainfall Patterns in Australia
450 likes | 573 Vues
This presentation by Dr. Seth Westra explores the dynamics of sub-daily rainfall in Australia through various analytical lenses. It covers the sub-daily rainfall dataset, the relationship between temperature and rainfall intensity, and detection of trends in extreme events. The presentation also discusses the development of a downscaling algorithm for sub-daily rainfall and evaluates the performance of regional climate models using the diurnal cycle of precipitation. Dr. Westra's work aims to enhance our understanding of how climate change influences rainfall patterns and trends.

Investigating Changes in Sub-Daily Rainfall Patterns in Australia
E N D
Presentation Transcript
Changes to sub-daily rainfall in Australia Dr Seth Westra
Presentation overview • Part 1: The sub-daily rainfall dataset in Australia • Part 2: The observed relationship between temperature, humidity and rainfall intensity • Part 3: Detection of trends in sub-daily rainfall • Part 4: Towards a downscaling algorithm for sub-daily rainfall • Part 5: Evaluating regional climate model (WRF) performance using the diurnal cycle of sub-daily precipitation
Part 1: Australian rainfall record • More than 19000 daily precipitation stations (read at 9am daily) • More than 1500 pluviograph stations (6-minute resolution)
Australian rainfall record – record length Pluviograph Daily
Part 2: Link between temperature and extreme rainfall Extreme rainfall will scale at C-C rate of ~7%/C or “super C-C” rate of ~15%/C
Methodology • Reproduce this work using Australia-wide data: • 137 long pluviograph records (average length 32 years, with average of 6% missing) • Mean and maximum daily 2m air temperature extracted for each wet day • Data grouped into 15 bins by temperature – and different percentile (e.g. 50, 99%ile) rainfall extracted in each bin • Where available, relative humidity also extracted
Methodology Hardwick-Jones, R., Westra, S. & Sharma, A., 2010, “Observed relationships between extreme sub-daily precipitation, surface temperature, and relative humidity”, Geophysical Research Letters, 37, L22805
60-minute rainfall intensity against average daily temperature Blue = 99 percentile rainfall (representing behaviour of ‘extremes’)Red = 50 percentile rainfall (representing behaviour of ‘average’ events)
60-minute rainfall intensity against average daily temperature Blue = 99 percentile rainfall (representing behaviour of ‘extremes’)Red = 50 percentile rainfall (representing behaviour of ‘average’ events)
Summary of temperature scaling work • Clear scaling of rainfall with temperature across Australia • Scaling depends on duration of storm burst, and exceedance probability • Scaling also depends on atmospheric temperature – negative scaling with high temperatures! • Likely to be due to access to atmospheric moisture • BUT: Does a historical scaling relationship imply similar future changes?
Part 2: Detection of trends in Australian rainfall • We wish to detect whether there are trends or other types of climatic non-stationarity in extreme precipitation data • Consider the following hypothetical example: • ‘Extreme’ precipitation will scale at a rate of 7%/C in proportion to the water holding capacity of the atmosphere • Global warming trend has been ~0.74C over the 20th century • Therefore would need to be able to detect a ~5% change
Motivation • Assuming 50 years of data, such a trend would be detected at the 5% significance level in only 8% of samples (and a negative trend detected in 2% of samples!)
What is a max-stable process? • Formal definition: suppose for , i = 1,..., n, are independent realisations of a continuous process. If the limit: exists for all s with normalising constants an(s) and bn(s), then is a max-stable process. • Spatial analogue of multivariate extreme value models, which accounts for both data-leveldependence and parameter-level dependence. • Distinct from ‘Spatial GEV’ models which only account for parameter-level dependence.
Illustration of max-stable process • The ‘storm profile’ model:
Benefits for trend detection • Can improve the strength of the trend that can be detected (given by value of parameter ‘β1’), depending on the amount of spatial correlation.
Application to Australian rainfall data • Of Australia’s ~1400 sub-daily records, we selected the 35 most complete stations with records from 1965-2005. • Extracted annual maximum data for 6-minute through to 72 hour storm bursts • Also considered high quality daily data from 1910 to 2005
Application to Australian rainfall • Trends in annual maximum 6-minuterainfall • Blue/red indicates increasing/decreasing trend • Filled circles indicatestatistically significantat the 5% level
Is there an increasing trend in east-Australian precipitation?
Sensitivity to gauge changes • Many sub-daily stations had at least one gauge change over the record, usually from Dines pluviograph to TBRG • Tested sensitivity by extracting any ‘step change’ in the year the gauge change occurred, and then re-fitting the trend. • Did not make any significant difference to the strength of the trends in the previous slide
Summary of trend detection work • Max-stable processes provide an elegant way of detecting non-stationarity in hydroclimatic data • Enables substitution of ‘space-for-time’ while accounting for spatial dependence • In east-Australia an increasing trend in sub-daily (particularly sub-hourly) precipitation data could be detected, but not for daily data • This would suggest that sub-daily precipitation is increasing much more quickly than expected • Also highlights that daily data cannot be usedfor inference at shorter timescales Westra, S. & Sisson, A., 2011, “Detection of non-stationarity in precipitation extremes using a max-stable process model”, Journal of Hydrology, 406
Part 4: Disaggregating from daily to sub-daily rainfall under a future climate • We have shown that the scaling of rainfall with atmospheric temperature depends on storm burst duration, exceedance probability, and moisture availability • How can this be used for estimating change in sub-daily rainfall under a future climate? • Various techniques are available for downscaling daily rainfall under a future climate • We have developed an algorithm to disaggregate from daily to sub-daily rainfall under a future climate.
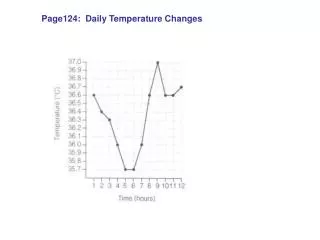
Importance of seasonality on daily to sub-daily scaling • Scaling from daily to sub-daily rainfall strongly depends on atmospheric temperature
Plotting against both temperature and day of year • BUT – most of the annual variation can actually be attributed to atmospheric temperature!
Influence of location – before and after regressing against atmospheric temperature
Algorithm Assume we have future sequences of daily rainfall available (e.g. from a statistical or dynamical downscaling algorithm), as well as atmospheric covariates • Given a future daily rainfall amount and associated atmospheric covariates (e.g. temperature, relative humidity, geopotential height...) • Find days in the historical record which have a ‘similar’ atmospheric state and daily rainfall amount and also the complete sub-daily rainfall sequence • Sample from one of those days
A disaggregation algorithm for downscaling sub-daily rainfall Westra, S., Evans, J., Mehrotra, R. & Sharma, A., “Disaggregating from daily to sub-daily rainfall under a future climate”, submitted to Journal of Climate
Summary of sub-daily disaggregation • Disaggregation algorithm is a simple ‘analogues’ based approach for understanding sub-daily rainfall behaviour under a future climate • Requires daily downscaling information, but such information is often readily available • Shows substantial changes can be expected at hourly or sub-hourly timescales.
Part 5: Diurnal cycle of modelled and observed rainfall • Good performance of a dynamical model in capturing the diurnal cycle provides a positive indication that the processes of sub-daily precipitation are correctly represented. Evans, J. & Westra, S., “Investigating the mechanisms of diurnal rainfall variability using a Regional Climate Model”, submitted to Journal of Climate
Diurnal cycle of different precipitation generating mechanisms
Conclusions and ongoing work • Evaluated scaling relationships of sub-daily rainfall and found strong dependence on temperature and atmospheric moisture • Trend detection work also shows increasing trends in fine time-scale (particularly sub-hourly) rainfall • Significant implications for urban flood risk and risk of flash flooding • Developed statistical disaggregation algorithm to generate sub-daily rainfall sequences conditional to daily rainfall, under a future climate. • Also collaborating with dynamical climate modellers to evaluate capacity of regional climate models to simulate sub-daily precipitation
References • Hardwick-Jones, R., Westra, S. & Sharma, A., 2010, “Observed relationships between extreme sub-daily precipitation, surface temperature, and relative humidity”, Geophysical Research Letters, 37, L22805 • Westra, S. & Sisson, A., 2011, “Detection of non-stationarity in precipitation extremes using a max-stable process model”, Journal of Hydrology, 406 • Westra, S., Mehrotra, R., Sharma, A. & Srikanthan, S., 2012, Continuous rainfall simulation: 1. A regionalised sub-daily disaggregation approach, Water Resources Research, 48 (W01535). • Westra, S., Evans, J., Mehrotra, R. & Sharma, A., “Disaggregating from daily to sub-daily rainfall under a future climate”, submitted to Journal of Climate • Evans, J. & Westra, S., “Investigating the mechanisms of diurnal rainfall variability using a Regional Climate Model”, submitted to Journal of Climate