Download

1 / 23
230 likes | 377 Vues
Statistical Analysis of cDNA microarrays II. Terry Speed. Outline. Different types of questions asked in microarray experiments Cluster analysis Single gene method A synthesis . Gene Expression Data. Gene expression data on p genes for n samples. mRNA samples.

E N D
Statistical Analysis of cDNA microarrays II Terry Speed
Outline Different types of questions asked in microarray experiments Cluster analysis Single gene method A synthesis
Gene Expression Data Gene expression data on p genes for n samples mRNA samples sample1 sample2 sample3 sample4 sample5 … 1 0.46 0.30 0.80 1.51 0.90 ... 2 -0.10 0.49 0.24 0.06 0.46 ... 3 0.15 0.74 0.04 0.10 0.20 ... 4 -0.45 -1.03 -0.79 -0.56 -0.32 ... 5 -0.06 1.06 1.35 1.09 -1.09 ... Genes Gene expression level of gene i in mRNA sample j Log( Red intensity / Green intensity) = Log(Avg. PM - Avg. MM)
Experiments, horses for courses mRNA levels compared in many different contexts • Tumour cell lines • Different tissues, same organism • Same tissue, different organisms (wt, ko, tg) • Same tissue, same organism (trt vs ctl) • Time course experiments No single method of analysis can be appropriate for all. Rather, each type of experiment requires its own analysis.
Cluster Analysis Can cluster genes, cell samples, or both. Strengthens signal when averages are taken within clusters of genes (Eisen). Useful (essential ?) when seeking new subclasses of cells, tumours, etc. Leads to readily interpreted figures.
Clusters Taken from Nature February, 2000 Paper by Allzadeh. A et al Distinct types of diffuse large B-cell lymphoma identified by Gene expression profiling,
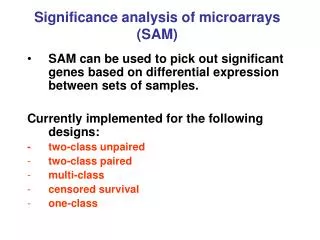
Which genes have changed? This is a common enough question. We will illustrate one approach when replicatesare available. GOAL: Identify genes with altered expression in the livers of one line of mice with very low HDL cholesterol levels compared to inbred control mice. Experiment: Apo AI knock-out mouse model 8 knockout (ko) mice and 8 control (ctl) mice (C57Bl/6). 16 hybridisations: mRNA from each of the 16 mice is labelled with Cy5, pooled mRNA from control mice is labelled with Cy3. Probes: ~6,000 cDNAs, including 200 related to lipid metabolism.
Which genes have changed? 1. For each gene and each hybridisation (8 ko + 8 ctl), use M=log2(R/G). 2. For each gene form the t statistic: average of 8 ko Ms - average of 8 ctl Ms sqrt(1/8 (SD of 8 ko Ms)2 + (SD of 8 ctl Ms)2) 3. Form a histogram of 6,000 t values. 4. Do a normal Q-Q plot; look for values “off the line”. 5. Adjust for multiple testing.
Histogram ApoA1
Assigning p-values to measures of change • Estimate p-values for each comparison (gene) by using the permutation distribution of the t-statistics. • For each of the possible permutation of the trt / ctl labels, compute the two-sample t-statistics t* for each gene. • The unadjusted p-value for a particular gene is estimated by the proportion of t*’s greater than the observed t in absolute value.
Multiple Testing Problem: We have just performed ~6000 tests! => need to control the family-wise false positive rate (Type I error). => use adjusted p-values. Bonferroni adjustment. Multiply p-values by number of tests. Too conservative, doesn’t take into account the dependence structure between the genes. Westfall & Young. Estimate adjusted p-values using the permutation distribution of statistics which take into account the dependence structure between the genes. Less conservative.
Apo A1: Adjusted and Unadjusted p-values for the 50 genes with the larges absolute t-statistics.
Limitations Cluster analyses: 1) Usually outside the normal framework of statistical inference; 2) less appropriate when only a few genes are likely to change. 3) Needs lots of experiments Single gene tests: 1) may be too noisy in general to show much 2) may not reveal coordinated effects of positively correlated genes. 3) hard to relate to pathways.
A synthesis We and others (Stanford) are working on methods which try to combine the best of both of the preceding approaches. Try to find clusters of genes and average their responses to reduce noise and enhance interpretability. Use testing to assign significance with averages of clusters of genes as we did with single genes.
Clustering genes E.g. p=5 Let p = number of genes. 1. Calculate within class correlation. 2. Perform hierarchical clustering which will produce (2p-1) clusters of genes. 3. Average within clusters of genes. 4 Perform testing on averages of clusters of genes as if they were single genes. Cluster 6=(1,2) Cluster 7=(1,2,3) Cluster 8=(4,5) Cluster 9= (1,2,3,4,5) 1 2 3 4 5
Data - Ro1 Transgenic mice with a modified Gi coupled receptor (Ro1). Experiment: induced expression of Ro1 in mice. 8 control (ctl) mice 9 treatment mice eight weeks after Ro1 being induced. Long-term question: Which groups of genes work together. Based on paper: Conditional expression of a Gi-coupled receptor causes ventricular conduction delay and a lethal cardiomyopathy, see Redfern C. et al. PNAS, April 25, 2000. http://www.pnas.orgalso http://www.GenMAPP.org/ (Conklin lab, UCSF)
Histogram Cluster of genes (1703, 3754)
Top 15 averages of gene clusters T Group ID -13.4 7869 = (1703, 3754) -12.1 3754 11.8 6175 11.7 4689 11.3 6089 11.2 1683 -10.7 2272 10.7 9955 = (6194, 1703, 3754) 10.7 5179 10.6 3916 -10.4 8255 = (4572, 4772, 5809) -10.4 4772 -10.4 10548 = (2534, 1343, 1954) 10.3 9476 = (6089, 5455, 3236, 4014) Might be influenced by 3754 Correlation
Limitation Hard to extend this method to negatively correlated clusters of genes. Need to consider together with other methods. Need to identify high averages of clusters of genes that are due to high averages from sub-clusters of those genes.
Yee Hwa Yang Sandrine Dudoit Natalie Roberts Ben Bolstad Ingrid Lonnstedt Karen Vranizan WEHI Bioinformatics group Matt Callow (LBL) Bruce Conklin (UCSF) Acknowledgments