Download
1 / 72
720 likes | 1.14k Vues
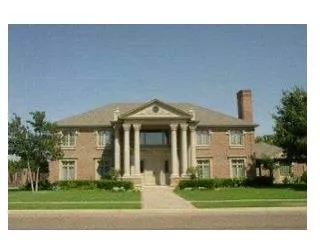
MY HOUSE – HOUSE # 1. HOUSE # 2. YOUR HOUSE –HOUSE # 3. HOUSE COSTS. HOUSE #1 HOUSE #2 HOUSE #3 Direct Material $140,000 $70,000 $90,000 Direct Labor 210,000 130,000 60,000 Overhead* ? ? ?

E N D
MY HOUSE – HOUSE # 1 HOUSE # 2 YOUR HOUSE –HOUSE # 3
HOUSE COSTS HOUSE #1HOUSE #2HOUSE #3 Direct Material $140,000 $70,000 $90,000 Direct Labor 210,000 130,000 60,000 Overhead* ? ? ? *Total indirect costs such as supervisory salaries and indirect materials amount to $84,000
Cost Object • The builder wants to determine the cost for each house • The house is the COST OBJECT
HOUSE COSTS HOUSE #1HOUSE #2HOUSE #3 Overhead* 28,000 28,000 28,000 *Total indirect costs such as supervisory salaries and indirect materials amount to $84,000 • There are three houses & each should have the same amount of overhead. • Do you agree?
Unitsproduced Machinehours Laborhours Milesdriven Use of Cost Drivers to Accumulate Costs A cost driver is anyfactor that causes or “drives”an activity’s costs
How should the costs be allocated? House 1House 2House 3 Ttl Direct Costs 350,000 200,000 150,000 Total Direct Costs for All Houses = $700,000 What cost needs to be allocated? $84,000 1st – Find Allocation Rate = $84,000 / $700,000 = 0.12 COST DRIVER
Overhead Cost Allocation • House 1 : $0.12 * 350,000 = 42,000 • House 2 : $0.12 * 200,000 = 24,000 • House 3 : $0.12 * 150,000 = 18,000
HOUSE #1HOUSE #2HOUSE #3 Direct Material $140,000 $70,000 $90,000 Direct Labor 210,000 130,000 60,000 Overhead* ? ? ? *Total indirect costs such as supervisory salaries and indirect materials amount to $84,000 Assume the $84,000 of total overhead cost consists of $63,000 of indirect materials and $21,000 of employee benefits.
Let’s start w/ $63,000 of Indirect Materials • What should we use to allocate the indirect materials? • Direct Material • Total Direct Materials = $300,000 • Amount to Allocate = $63,000 • Allocation Base = $300,000 • House 1: (63,000 / 300,000) * 140,000 = 29,400 COST DRIVER ALLOCATION RATE
What about the $21,000 Employee Benefits? What is the cost driver? Direct Labor What is the allocation base? $400,000 What amount needs to be allocated? $21,000 What is the allocation rate? $21,000 / $400,000 = 0.0525
Allocation of Benefits House 1: 0.0525 * 210,000 = 11,025 House 2: 0.0525 * 130,000 = 6,825 House 3: 0.0525 * 60,000 = 3,150
The Builder also incurred the following expenses: • Electric - $4,000 • Gas - $2,000 • Water - $1,000 • Telephone - $500 • Is it cost effective to allocate each of these expenses individually? • NO!
COST POOL Cost Pool Total = $7,500 Cost Pool = Utilities WATER $1,000 GAS $2000 TELEPHONE $500 ELECTRICITY $4,000
Cost Pool Allocation What should be use to allocate the utilities? What about square footage? House 1 = 5,000 sq ft House 2 = 3,000 sq ft House 3 = 1,000 sq ft Total Square Footage = 9,000 ALLOCATION BASE COST DRIVER
Allocation of Utilities Allocation Rate: $7,500 / 9,000 = $0.833 House 1: $0.833 * 5,000 = 4,167 House 2: $0.833 * 3,000 = 2,500 House 3: $0.833 * 1,000 = 833
Estimated Versus Actual Cost Actual CostsKnowledge of actual costs, after the fact, may not be useful for planning and decision making. Estimated CostsManagers use estimated costs tomake decisions about the future.
Timely Relevant PotentialInaccuracies Estimated Versus Actual Cost Estimated CostsManagers use estimated costs tomake decisions about the future.
Estimated Versus Actual Cost Timely Relevant PotentialInaccuracies Estimated CostsMay be used to set prices, make bids, evaluate proposals, distribute resources, plan production, and set goals.
Identifying Direct Versus Indirect Costs In Style, Inc. Department Store pays a bonus to eachdepartment manager based on departmental sales. The incentive has increased departmental sales, but departmental profits have not increased accordingly. Management has decided to base future bonuseson department profitability.
Identifying Direct Versus Indirect Costs The first step in the development of the new bonusstrategy is to determine the costs of each department. Costs that can be traced to departments in acost-effective manner are called direct costs. Costs that cannot be traced to departments in acost-effective manner are called indirect costs.
Identifying Direct Versus Indirect Costs Direct and indirect costs may be either fixed or variable. A cost can be either direct or indirectdepending on the cost object. The store manager salary is indirect to any onedepartment, but is directly traceable to the store.
Allocating Indirect Costs to Departments Identify the most appropriate costdriver for each indirect cost. Indirect costs should be allocated to reflecthow the departments consume resources. InStyle, Inc. chosethese cost drivers:
Allocating Indirect Costs to Departments • Use a two-step process to allocate indirect costs: • Allocation rate = total cost ÷ cost driver activity. • Allocated cost = allocation rate × weight of the cost driver activity.
Allocating Indirect Costs to Departments • $9,360 ÷ 3 departments = $3,120 per department • $3,120 × 1 department = $3,120
Allocating Indirect Costs to Departments • $18,400 ÷ 23,000 square feet = $0.80 per square foot • $0.80 × 12,000 Women’s square feet = $9,600 $0.80 × 7,000 Men’s square feet = $5,600 $0.80 × 4,000 Children’s square feet = $3,200
Allocating Indirect Costs to Departments • $2,300 ÷ 23,000 square feet = $0.10 per square foot • $0.10 × 12,000 Women’s square feet = $1,200 $0.10 × 7,000 Men’s square feet = $700 $0.10 × 4,000 Children’s square feet = $400
Allocating Indirect Costs to Departments • $7,200 ÷ $360,000 sales = $0.02 per sales dollar • $0.02 × $190,000 Women’s sales = $3,800 $0.02 × $110,000 Men’s sales = $2,200 $0.02 × $60,000 Children’s sales = $1,200
Allocating Indirect Costs to Departments • $900 ÷ $360,000 sales = $0.0025 per sales dollar • $0.0025 × $190,000 Women’s sales = $475 $0.0025 × $110,000 Men’s sales = $275 $0.0025 × $60,000 Children’s sales = $150
Now let’s combine thecosts and revenues andsee how departmentalprofitability looks. Allocating Indirect Costs to Departments
Does this mean that I should use different costdrivers for variable andfixed overhead? The Effects of Cost Behavior on Cost Driver Selection
UnitsProduced LaborHours MaterialsUsed Using Volume Measures to Allocate Variable Overhead Costs Increases in the volume of production willcause variable overhead costs to increase. Volume measuresserve as good cost driversfor the allocation ofvariable overhead.
Using Volume Measures to Allocate Variable Overhead Costs Filmier Furniture CompanyProduction and Cost Information Use the two-step process to allocate indirect materialscost using the three volume measures as cost drivers.
Using Volume Measures to Allocate Variable Overhead Costs • $60,000 ÷ 5,000 units = $12 per unit • $12 per unit × 4,000 chairs = $48,000 $12 per unit × 1,000 desks = $12,000
Using Volume Measures to Allocate Variable Overhead Costs • $60,000 ÷ 6,000 hours = $10 per hour • $10 per hour × 3,500 hours = $35,000 $10 per hour × 2,500 hours = $25,000
Using Volume Measures to Allocate Variable Overhead Costs • $60,000 ÷ $1,500,000 of direct material = $0.04 per dollar of direct material • $0.04 per $ × $1,000,000 = $40,000 $0.04 per $ × $500,000 = $20,000
So which volume measure shouldI use? Selecting the Best Cost Driver Judgment and reasoning are necessary. Considerations Relationship between cost driver activity and use of resources. Availability of information.
Allocating Fixed Overhead Costs Objective Distribute a fair share of theoverhead cost to each product. There are novolume based costdrivers forfixed overhead.
Allocating Fixed Overhead Costs Belview Company Information Use the two-step process to allocate the fixed rentalcost to units sold and to units in ending inventory.
$28,000 ÷ 2,000,000 units = $0.014 per unit • $0.014 per unit × 1,800,000 units = $25,200 $0.014 per unit × 200,000 units = $2,800 Allocating Fixed Overhead Costs
Allocating Costs to Solve Timing Problems Allocating fixed costs can be complicated when thevolume of production varies from month to month. If prices are based on these costs, units produced inJanuary will be higher than those produced in February. Will customers think this is reasonable?
Estimated overhead the year POHR = Estimated allocation base for the year $36,000 POHR = = $2.00 per unit 18,000 units Allocating Costs to Solve Timing Problems We solve this problem by using estimatedcosts and estimated production for the year toobtain a predetermined overhead rate (POHR). $2.00 allocated to each unit producedfor all months during the year.
Establishing Cost Pools This is the problem when we don’tuse cost pools to allocate costs. IndirectCost 1 Product1 IndirectCost 2 Product2 IndirectCost 3 IndirectCost 4 Product3 IndirectCost 5 15 allocations
Establishing Cost Pools Cost pools reduce the numberof cost allocation computations. IndirectCost 1 Product1 IndirectCost 2 CostPool Product2 IndirectCost 3 Threeallocations IndirectCost 4 Product3 IndirectCost 5 Contains indirect costs relatedto a common cost driver.
Allocating Joint Costs Product Joint Costs Product Product
Allocating Joint Costs Key terms Joint products– products resulting from a process with a common input. Split-off point– the stage of processing where joint products are separated. Joint cost– costs of processing joint products prior to the split-off point.