Download
1 / 2
20 likes | 142 Vues

E N D
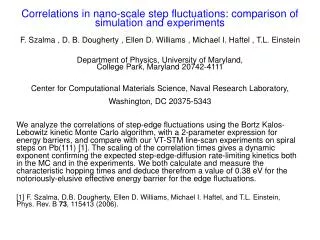
Correlations in nano-scale step fluctuations: comparison of simulation and experimentsF. Szalma , D. B. Dougherty , Ellen D. Williams , Michael I. Haftel , T.L. EinsteinDepartment of Physics, University of Maryland, College Park, Maryland 20742-4111Center for Computational Materials Science, Naval Research Laboratory, Washington, DC 20375-5343 We analyze the correlations of step-edge fluctuations using the Bortz Kalos-Lebowitz kinetic Monte Carlo algorithm, with a 2-parameter expression for energy barriers, and compare with our VT-STM line-scan experiments on spiral steps on Pb(111) [1]. The scaling of the correlation times gives a dynamic exponent confirming the expected step-edge-diffusion rate-limiting kinetics both in the MC and in the experiments. We both calculate and measure the characteristic hopping times and deduce therefrom a value of 0.38 eV for the notoriously-elusive effective energy barrier for the edge fluctuations. [1] F. Szalma, D.B. Dougherty, Ellen D. Williams, Michael I. Haftel, and T.L. Einstein, Phys. Rev. B 73, 115413 (2006).
Correlations in nano-scale step fluctuations: comparison of simulation and experiments Arrhenius plot of hopping times. The experimental results are plotted with two different kink energies, 50meV (diamonds) and 65meV (squares). The kinetic Monte Carlo (KMC) data are depicted in circles with a thick solid-line as a guide to the eye. The error bars are indicated on the experimental data along with a linear fit (dashed lines). The room temperature experimental data agrees well with the KMC results and the dotted lines indicate how we speculate these data might continue if the experiments had gone below room temperature. The slopes of the fits (dashed lines) to all data points except the highest temperature ones in both data sets show the energy barriers to be apparently higher than that of the KMC. Sample configuration on triangular lattice, indicating our nomenclature for the nearest-neighbor sites of the adatom before and after the kinetic Monte Carlo move. In this case the move is labelled 01 since site 0 and 1 are occupied among the eight NN sites surrounding the two sites involved in the hop.