Download
1 / 6
60 likes | 78 Vues
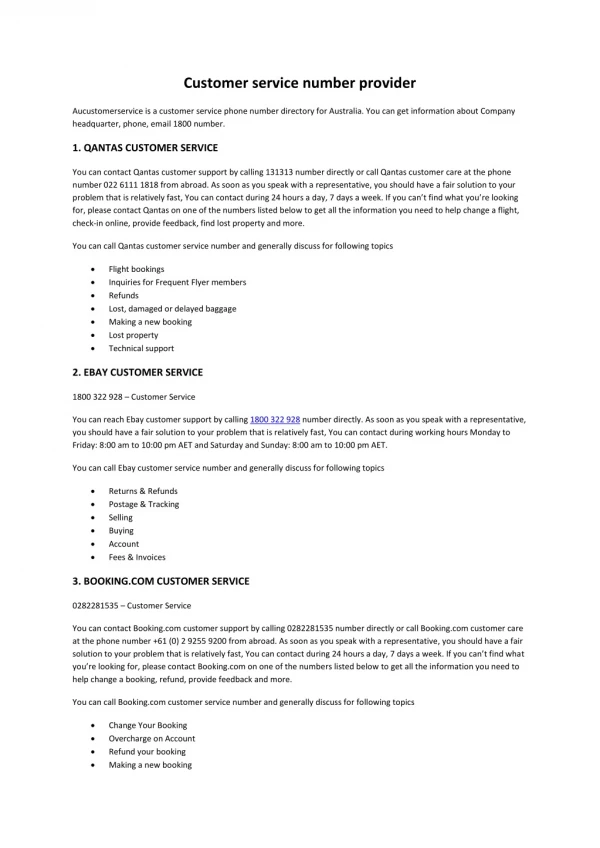
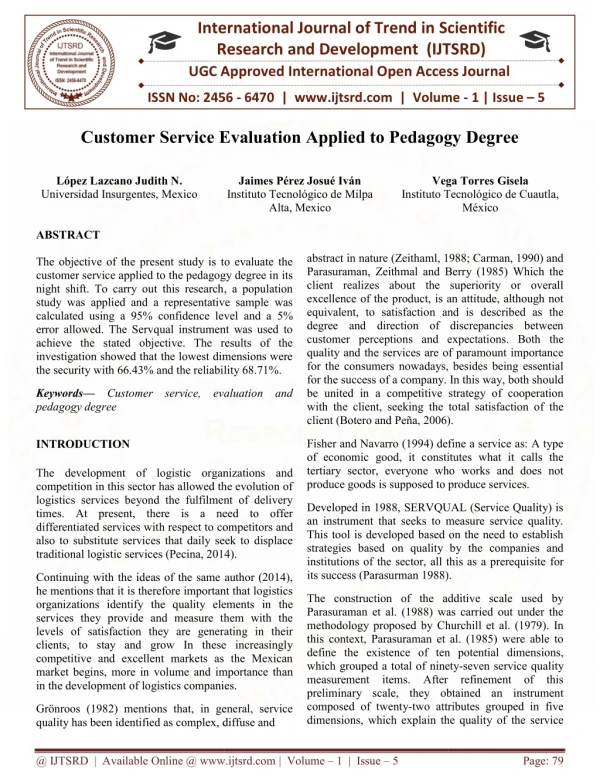
The objective of the present study is to evaluate the customer service applied to the pedagogy degree in its night shift. To carry out this research, a population study was applied and a representative sample was calculated using a 95 confidence level and a 5 error allowed. The Servqual instrument was used to achieve the stated objective. The results of the investigation showed that the lowest dimensions were the security with 66.43 and the reliability 68.71 . Lu00c3u00b3pez Lazcano Judith N. | Jaimes Pu00e9:rez Josuu00e9: Ivu00c3u00a1n | Vega Torres Gisela "Customer Service Evaluation Applied to Pedagogy Degree" Published in International Journal of Trend in Scientific Research and Development (ijtsrd), ISSN: 2456-6470, Volume-1 | Issue-5 , August 2017, URL: https://www.ijtsrd.com/papers/ijtsrd2234.pdf Paper URL: https://www.ijtsrd.com/other-scientific-research-area/other/2234/customer-service-evaluation-applied-to-pedagogy-degree/lu00f3pez-lazcano-judith-n<br>

E N D
International Research UGC Approved International Open Access Journal UGC Approved International Open Access Journal Customer Service Evaluation Applied to Pedagogy Degree Customer Service Evaluation Applied to Pedagogy Degree International Journal of Trend in Scientific Research and Development (IJTSRD) UGC Approved International Open Access Journal Scientific (IJTSRD) ISSN No: 2456 ISSN No: 2456 - 6470 | www.ijtsrd.com | Volume www.ijtsrd.com | Volume - 1 | Issue – 5 Customer Service Evaluation Applied to Pedagogy Degree López Lazcano Judith N. Universidad Insurgentes, Mexico Jaimes Pérez Josué Iván Instituto Tecnológico de Milpa Alta, Mexico Vega Torres Instituto Tecnológico de Cuautla, Instituto Tecnológico de Cuautla, México Vega Torres Gisela ABSTRACT The objective of the present study is to evaluate the customer service applied to the pedagogy degree in its night shift. To carry out this research, a population study was applied and a representative sample was calculated using a 95% confidence level and a error allowed. The Servqual instrument was used to achieve the stated objective. The results of the investigation showed that the lowest dimensions were the security with 66.43% and the reliability 68.71% the security with 66.43% and the reliability 68.71%. abstract in nature (Zeithaml, 1988; Carman, 1990) and Parasuraman, Zeithmal and Berr client realizes about the superiority or overall excellence of the product, is an attitude, although not equivalent, to satisfaction and is described as the degree and direction of discrepancies between customer perceptions and expectati quality and the services are of paramount importance for the consumers nowadays, besides being essential for the success of a company. In this way, both should be united in a competitive strategy of cooperation with the client, seeking the to client (Botero and Peña, 2006). client (Botero and Peña, 2006). abstract in nature (Zeithaml, 1988; Carman, 1990) and Parasuraman, Zeithmal and Berry (1985) Which the client realizes about the superiority or overall excellence of the product, is an attitude, although not equivalent, to satisfaction and is described as the degree and direction of discrepancies between customer perceptions and expectations. Both the quality and the services are of paramount importance for the consumers nowadays, besides being essential for the success of a company. In this way, both should be united in a competitive strategy of cooperation with the client, seeking the total satisfaction of the objective of the present study is to evaluate the customer service applied to the pedagogy degree in its night shift. To carry out this research, a population study was applied and a representative sample was calculated using a 95% confidence level and a 5% error allowed. The Servqual instrument was used to achieve the stated objective. The results of the investigation showed that the lowest dimensions were Keywords— Customer service, evaluation and pedagogy degree Customer service, evaluation and Fisher and Navarro (1994) define a service as: A type of economic good, it constitutes what it calls the tertiary sector, everyone who works and does not produce goods is supposed to produce services. produce goods is supposed to produce services. Fisher and Navarro (1994) define a service as: A type of economic good, it constitutes what it calls the tertiary sector, everyone who works and does not INTRODUCTION The development of logistic organizations and competition in this sector has allowed the evolution of logistics services beyond the fulfilment of delivery times. At present, there is a need to offer differentiated services with respect to competitors and also to substitute services that daily seek to displace traditional logistic services (Pecina, 2014). traditional logistic services (Pecina, 2014). The development of logistic organizations and competition in this sector has allowed the evolution of logistics services beyond the fulfilment of delivery times. At present, there is a need to offer Developed in 1988, SERVQUAL (Service Quality) is an instrument that seeks to measure service quality. This tool is developed based on the need to establish strategies based on quality by the companies and institutions of the sector, all this as a prerequi its success (Parasurman 1988). its success (Parasurman 1988). Developed in 1988, SERVQUAL (Service Quality) is an instrument that seeks to measure service quality. This tool is developed based on the need to establish strategies based on quality by the companies and institutions of the sector, all this as a prerequisite for spect to competitors and also to substitute services that daily seek to displace Continuing with the ideas of the same author (2014), he mentions that it is therefore important that logistics organizations identify the quality elements in the services they provide and measure them with the levels of satisfaction they are generating in their clients, to stay and grow In these increasingly competitive and excellent markets as the Mexican market begins, more in volume and importance than in the development of logistics companies. in the development of logistics companies. Continuing with the ideas of the same author (2014), he mentions that it is therefore important that logistics tify the quality elements in the services they provide and measure them with the levels of satisfaction they are generating in their clients, to stay and grow In these increasingly competitive and excellent markets as the Mexican The construction of the additive scale used by Parasuraman et al. (1988) was carried out under the methodology proposed by Churchill et al. (1979). In this context, Parasuraman et al. (1985) were able to xistence of ten potential dimensions, which grouped a total of ninety-seven service quality measurement items. After refinement of this preliminary scale, they obtained an instrument two attributes grouped in five The construction of the additive scale used by Parasuraman et al. (1988) was carried out under the methodology proposed by Churchill et al. (1979). In this context, Parasuraman et al. (1985) were able to define the existence of ten potential dimensions, which grouped a total of ninety measurement items. After refinement of this preliminary scale, they obtained an instrument composed of twenty-two attributes grouped in five dimensions, which explain the quality of the service in the quality of the service ume and importance than Grönroos (1982) mentions that, in general, service quality has been identified as complex, diffuse and quality has been identified as complex, diffuse and Grönroos (1982) mentions that, in general, service @ IJTSRD | Available Online @ www.ijtsrd.com @ IJTSRD | Available Online @ www.ijtsrd.com | Volume – 1 | Issue – 5 Page: 79
International Journal of Trend in Scientific Research and Development (IJTSRD) ISSN: 2456-6470 in the industries of this sector. These five dimensions are defined below, according to the findings of Parasuraman et al. (1988). The development of this work will also serve as a reference guide for all schools that wish to measure the service they provide to students. Tangibles: Physical facilities, equipment and appearance of staff. Reliability: Ability of service to perform as promised reliably and accurately. Responsiveness: Willingness to help clients and provide them with an appropriate service. Safety: Knowledge and courtesy of employees and their ability to inspire confidence. Empathy: Care and personalized attention that the service company gives to its clients. METHODOLOGY The study population will be the students of pedagogy of the shift. Table 1 shows the distribution of men and women who make up this study area. Table 1: Example of Study Population Gender Female Male Total 94 42 In the table above it can be observed that there are more women who study the degree of pedagogy. Once the study population was known, the representative sample of the study was calculated. A 95% confidence interval and a maximum permissible error of 5% were used for the investigation. The formula used was the one proposed by Dr. Bolaños (2012), which is used for finite or known populations. The formula is as follows: Where: N: sample size N: population size Z: value corresponding to the gauss distribution, for the investigation Z = 95%, which is equal to 1.96. P: expected prevalence of the parameter to be evaluated, if not known (p = 0.5), which makes the sample size larger. Q: 1 - p (if p = 70%, q = 30%) I: error expected to be committed if it is 5%, i = 0.05 GENERAL OBJECTIVE Evaluate the customer service in the students of the degree of pedagogy in the area of coordination in their night shift. SPECIFIC OBJECTIVES Identify the areas of opportunity that the pedagogical coordination area has regarding student service. Evaluate the customer service in the students of the pedagogy degree in their night shift of the coordination area. Propose improvement alternatives for the service to students in the area of coordination. 2 Z * N * p 2 * q n 2 i ( N ) 1 Z * p * q JUSTIFICATION Customer service is a key differentiator in marketing, thanks to it can be positioned in the minds of potential customers and generate a competitive advantage. Satisfaction and customer value generation are two factors that influence the customer both before and after receiving the service (Blanco, 2009). The development of the formula is as follows: * ) 96 . 1 ( 2 136 5 . 0 * 5 . 0 * 130 . 6144 130 . 6144 n 100 . 63 101 ) 1 2 2 6 . 0 ( 05 ) 136 ( . 1 ( 96 ) 5 . 0 * 5 . 0 * . 0 3375 . 0 9604 . 1 2979 @ IJTSRD | Available Online @ www.ijtsrd.com | Volume – 1 | Issue – 5 Page: 80
International Journal of Trend in Scientific Research and Development (IJTSRD) ISSN: 2456 International Journal of Trend in Scientific Research and Development (IJTSRD) ISSN: 2456 International Journal of Trend in Scientific Research and Development (IJTSRD) ISSN: 2456-6470 The study noted that of a population of 136 students with which the University counts, using 95% reliability and 5% error allowed, will require 101 teachers for research. The study noted that of a population of 136 students with which the University counts, using 95% reliability and 5% error allowed, will require 101 ANALYSIS OF RESULTS At this stage the results obtained will be described, once the surveys have been carried out to the At this stage the results obtained will once the surveys have been carried out to the representative sample of the study. representative sample of the study. Figure 1 represents the results of the dimension: Figure 1 represents the results of the dimension: Tangible elements. ELEMENTOS TANGIBLES ELEMENTOS TANGIBLES Pregunta Porcentaje 75.71 74.29 72.14 71.43 4 3 2 1 1 2 3 4 Figure 1: : Example of results of tangible elements. The previous figure shows that all the results of the questions that make up the dimension of Tangible Elements have results in average of 70%, which represents a regular result. have results in average of 70%, which represents a regular result. The previous figure shows that all the results of the questions that make up the dimension of Tangible Elements The previous figure shows that all the results of the questions that make up the dimension of Tangible Elements Figure 2 represents the results of the dimension: Reliability. the dimension: Reliability. FIABILIDAD Pregunta Porcentaje 71.43 68.57 68.57 67.86 67.14 9 8 7 6 6 5 1 2 3 4 5 Figure 2: Example of results of reliability elements Figure 2: Example of results of reliability elements The previous figure shows that all the results of the questions that make up the Reliability dimension have results on average of 68%, which represents a regular result. The previous figure shows that all the results of the questions that make up the Reliability dimension have The previous figure shows that all the results of the questions that make up the Reliability dimension have results on average of 68%, which represents a regular result. @ IJTSRD | Available Online @ www.ijtsrd.com @ IJTSRD | Available Online @ www.ijtsrd.com | Volume – 1 | Issue – 5 Page: 81
International Journal of Trend in Scientific Research and Development (IJTSRD) ISSN: 2456 International Journal of Trend in Scientific Research and Development (IJTSRD) ISSN: 2456 International Journal of Trend in Scientific Research and Development (IJTSRD) ISSN: 2456-6470 Figure 3 represents the results of the dimension: Empathy. igure 3 represents the results of the dimension: Empathy. EMPATIA Pregunta Porcentaje 72.86 72.14 71.43 70.00 68.57 22 21 20 19 19 18 1 2 3 4 5 Figure 3: Examples of empathy elements results Figure 3: Examples of empathy elements results The previous figure shows that all the results of the questions that make up the Reliability dimension have an average result of 70%, which represents a regular result. ts a regular result. Figure 4 represents the results of the dimension: Response Capacity. The previous figure shows that all the results of the questions that make up the Reliability dimension have an The previous figure shows that all the results of the questions that make up the Reliability dimension have an Figure 4 represents the results of the dimension: Response Capacity. CAPACIDAD DE RESPUESTA CAPACIDAD DE RESPUESTA Pregunta Porcentaje 71.43 71.43 69.29 68.57 13 12 11 10 1 2 3 4 Figure 4: Example of results of responsiveness elements Figure 4: Example of results of responsiveness elements The previous figure shows that all the results of the questions that make up the Reliability dimension have average result of 70%, which represents a regular result. Figure 5 represents the results of the dimension: Security The previous figure shows that all the results of the questions that make up the Reliability dimension have an The previous figure shows that all the results of the questions that make up the Reliability dimension have average result of 70%, which represents a regular result. Figure 5 represents the results of the dimension: Security. @ IJTSRD | Available Online @ www.ijtsrd.com @ IJTSRD | Available Online @ www.ijtsrd.com | Volume – 1 | Issue – 5 Page: 82
International Journal of Trend in Scientific Research and Development (IJTSRD) ISSN: 2456 International Journal of Trend in Scientific Research and Development (IJTSRD) ISSN: 2456 International Journal of Trend in Scientific Research and Development (IJTSRD) ISSN: 2456-6470 SEGURIDAD Pregunta Porcentaje 68.57 68.57 64.29 64.29 17 16 15 14 1 2 3 4 Figure 5: Example of security elements results Figure 5: Example of security elements results The previous figure shows that all the results of the questions that make up the average result of 67%, which represents a regular result. average result of 67%, which represents a regular result. Figure 6 represents the results of each dimension and the average of the five dimensions. The previous figure shows that all the results of the questions that make up the Reliability dimension have an Reliability dimension have an Figure 6 represents the results of each dimension and the average of the five dimensions. Figure 6 represents the results of each dimension and the average of the five dimensions. PORCENTAJE 73.39 71 71 70.18 69.942 68.71 66.43 Figure 6: Figure 6: Example of results for each dimension The figure above shows the results of each dimension and the average of the five dimensions. It can be observed that the average satisfaction of the students of the degree of Pedagogy is 69.942%. This indicates that there are areas for improvement. The figure above shows the results of each dimension and the average of the five dimensions. It can be observed that the average satisfaction of the students of the degree of Pedagogy is 69.942%. This indicates The second dimension that must be worked is the ility dimension, which is to be careful in the ability of the service to perform as promised reliably The second dimension that must be worked is the reliability dimension, which is to be careful in the ability of the service to perform as promised reliably and accurately. CONCLUSIONS The first dimension that must be improved is the security dimension, which should establish courtesy strategies of the area of pedagogy and their ability to inspire confidence. The first dimension that must be improved is the security dimension, which should establish courtesy strategies of the area of pedagogy and their ability to Once the research was carried out, it was possible to obtain the evaluation of the customer service in the students of the pedagogy degree in the area of coordination in their night shift. coordination in their night shift. Once the research was carried out, it was possible to obtain the evaluation of the customer service in the dagogy degree in the area of @ IJTSRD | Available Online @ www.ijtsrd.com @ IJTSRD | Available Online @ www.ijtsrd.com | Volume – 1 | Issue – 5 Page: 83
International Journal of Trend in Scientific Research and Development (IJTSRD) ISSN: 2456-6470 Likewise, it was possible to identify the areas of opportunity that the area of pedagogical coordination has regarding the service of the students. Better Measures of Marketing Constructs”, Journal of Marketing Research, 11 (August), 254 –260 5)Fisher, L. y Navarro, V. (1994). Introducción a la investigación de mercado. México: McGraw-Hill Interamericana S.A. de C.V. 6)Grönroos, C. (1982). An applied service marketing theory. European Journal of Marketing, Nº 7, pp. 30-41. 7)Parasuraman, A., Zeithaml, V.A. y Berry, L.L. (1985). A Conceptual Model of Service Quality and Its Implications for Future Research. Journal of Marketing, vol. 49, pp. 41-50. 8)Parasuraman, A., Zeithaml, Valarie A., Berry, Leonard L. 1988. ”SERVQUAL: A Multiple-Item Scale For Measuring Consumer Perceptions of Service Quality”. Journal of Retailing, Vol. 64, N°1, 12 –40p. 9)Pecina Rivas, M. I. (2014). Retos en la formación de profesionales logísticos: competitividad. Universidad Autónomadel Estado de México. 10)Zeithaml, V.A. (1988). Consumer perceptions of price, quality, and value: a means-end model and syntesis of evidence. Journal of Marketing, pp. 52, -22. Finally, it was possible to propose alternatives of improvement for the service to the students in the area of coordination. ACKNOWLEDGMENT M.I.I. Arturo González Torres for his advice, mentoring and project management. BIBLIOGRAPHY 1)Blanco Pineros, J. (2009). Medición de la satisfacción del cliente del restaurante museo taurino, y formulación de estrategias de servicio para la creación de Administración de Empresas Bogotá. Facultad de Ciencias Económicas Pontificia Universidad Javeriana. 2)Botero, M. M. y Peña, P. (2006). Calidad de Servicio: El Cliente Incognito. Revista Suma Psicologica, Vol 13, N°2. 3)Carman, J. M. (1990). Consumer perceptions of service quality: an assessment of the SERVQUAL dimensions. Journal of Retailing, Vol. 66 (Primavera), pp. 33-55. 4)Churchill, Gilbert A., Jr., Neil M. Ford, Orville C. Walker, Jr., 1979. “A Paradigm for Developing valor. Carrera de y Administrativas. servicio y @ IJTSRD | Available Online @ www.ijtsrd.com | Volume – 1 | Issue – 5 Page: 84