Download
1 / 10
100 likes | 108 Vues
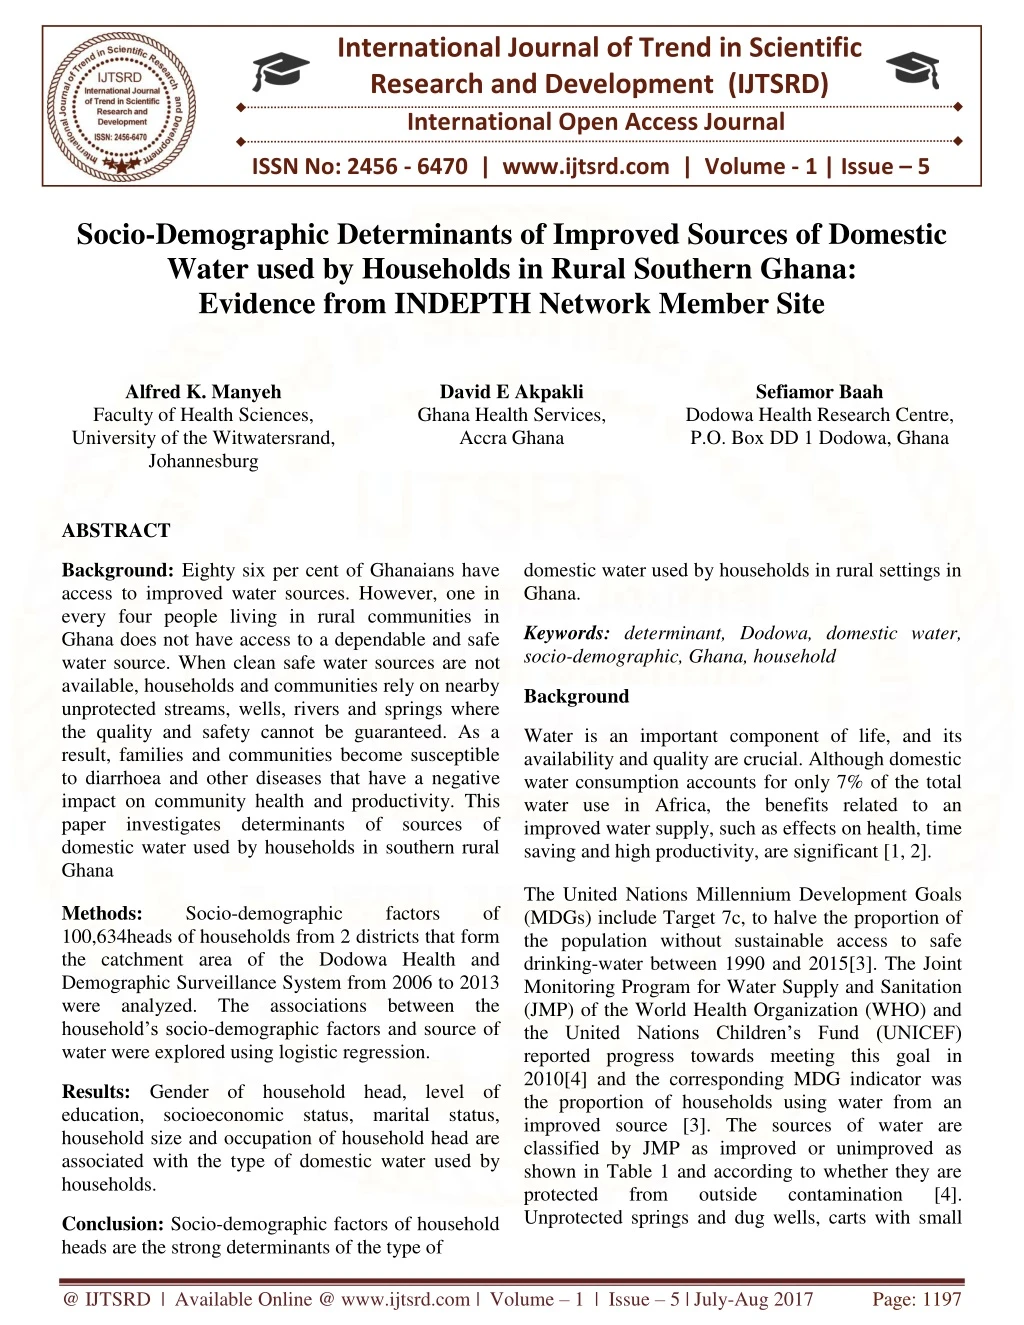
Background Eighty six per cent of Ghanaians have access to improved water sources. However, one in every four people living in rural communities in Ghana do not have access to a dependable and safe water source. When clean safe water sources are not available, households and communities rely on nearby unprotected streams, wells, rivers and springs where the quality and safety cannot be guaranteed. As a result, families and communities become susceptible to diarrhoea and other diseases that have a negative impact on community health and productivity. This paper investigates determinants of sources of domestic water used by households in southern rural Ghana Methods Socio demographic factors of 100,634 heads of households from 2 districts that form the catchment area of the Dodowa Health and Demographic Surveillance System from 2006 to 2013 were analyzed. The associations between the household's socio demographic factors and source of water were explored using logistic regression. Results Gender of household head, level of education, socioeconomic status, marital status, household size and occupation of household head are associated with the type of domestic water used by households. Conclusion Socio demographic factors of household heads are the strong determinants of the type of domestic water used by households in rural settings in Ghana. Alfred Kwesi Manyeh | David E Akpakli | Sefiamor Baah "Socio-Demographic Determinants of Improved Sources of Domestic Water used by Households in Rural Southern Ghana: Evidence from INDEPTH Network Member Site" Published in International Journal of Trend in Scientific Research and Development (ijtsrd), ISSN: 2456-6470, Volume-1 | Issue-5 , August 2017, URL: https://www.ijtsrd.com/papers/ijtsrd2276.pdf Paper URL: http://www.ijtsrd.com/other-scientific-research-area/other/2276/socio-demographic-determinants-of-improved-sources-of-domestic-water-used-by-households-in-rural-southern-ghana-evidence-from-indepth-network-member-site/alfred-kwesi-manyeh<br>

E N D
International Journal of Trend in Scientific Research and Development (IJTSRD) International Open Access Journal ISSN No: 2456 - 6470 | www.ijtsrd.com | Volume - 1 | Issue – 5 Socio-Demographic Determinants of Improved Sources of Domestic Water used by Households in Rural Southern Ghana: Evidence from INDEPTH Network Member Site Alfred K. Manyeh Faculty of Health Sciences, University of the Witwatersrand, Johannesburg David E Akpakli Ghana Health Services, Accra Ghana Sefiamor Baah Dodowa Health Research Centre, P.O. Box DD 1 Dodowa, Ghana ABSTRACT domestic water used by households in rural settings in Ghana. Background: Eighty six per cent of Ghanaians have access to improved water sources. However, one in every four people living in rural communities in Ghana does not have access to a dependable and safe water source. When clean safe water sources are not available, households and communities rely on nearby unprotected streams, wells, rivers and springs where the quality and safety cannot be guaranteed. As a result, families and communities become susceptible to diarrhoea and other diseases that have a negative impact on community health and productivity. This paper investigates determinants of sources of domestic water used by households in southern rural Ghana Keywords: determinant, Dodowa, domestic water, socio-demographic, Ghana, household Background Water is an important component of life, and its availability and quality are crucial. Although domestic water consumption accounts for only 7% of the total water use in Africa, the benefits related to an improved water supply, such as effects on health, time saving and high productivity, are significant [1, 2]. The United Nations Millennium Development Goals (MDGs) include Target 7c, to halve the proportion of the population without sustainable access to safe drinking-water between 1990 and 2015[3]. The Joint Monitoring Program for Water Supply and Sanitation (JMP) of the World Health Organization (WHO) and the United Nations Children’s Fund (UNICEF) reported progress towards meeting this goal in 2010[4] and the corresponding MDG indicator was the proportion of households using water from an improved source [3]. The sources of water are classified by JMP as improved or unimproved as shown in Table 1 and according to whether they are protected from outside Unprotected springs and dug wells, carts with small Methods: 100,634heads of households from 2 districts that form the catchment area of the Dodowa Health and Demographic Surveillance System from 2006 to 2013 were analyzed. The associations between the household’s socio-demographic factors and source of water were explored using logistic regression. Socio-demographic factors of Results: Gender of household head, level of education, socioeconomic status, marital status, household size and occupation of household head are associated with the type of domestic water used by households. contamination [4]. Conclusion: Socio-demographic factors of household heads are the strong determinants of the type of @ IJTSRD | Available Online @ www.ijtsrd.com | Volume – 1 | Issue – 5 | July-Aug 2017 Page: 1197
International Journal of Trend in Scientific Research and Development (IJTSRD) ISSN: 2456-6470 tanks, tanker trucks, and surface water are considered unimproved by some researchers[5]. world’s population would remain without access to improved sanitation in 2015 [6]. Using this classification, WHO and UNICEF estimate that 5.8 billion people used improved sources in 2010, with an estimated 783 million using unimproved water sources [4]. It has been shown that, for a household to fully benefit from an improved water supply, it must have access to safe and reliable water sources indoors. While this is almost always available in developed countries, such access is far from a reality in developing countries especially in rural areas in Africa [2]. Table 1:JMP Classification of drinking-water source types as improved or unimproved [4]. Source class Unimproved drinking- water source The burden of caring for family members who are ill with waterborne diseases and going to collect water often falls on female members of the household [7], and in Sub-Saharan Africa, rural women and young girls bear the brunt of spending six (6) hours dailywalking long distances tofetchwater for their households which takes time away from their families and other productive activities [8]. Type of source Unprotected unprotected spring, cart with small tank or drum, surface water (e.g. river, dam, lake, pond, stream, canal or irrigation channel) and bottled water. Piped water located inside the user’s dwelling, plot or yard. dug well, The lack of safe water, basic sanitation, and good hygiene practices is the third most significant risk factors for poor health in developing countries [9] hence, improving access to water supply and sanitation is essential development, poverty reduction and for human dignity[10]. Improved water source (piped to dwelling, plot or yard) Improved water source (other sources) drinking- connection for socio-economic drinking- Public taps or standpipes, ‘sachet’ water, tube wells or boreholes, protected dug wells, protected springs and rainwater collection. Eighty six per cent of Ghanaian household members have access to improved water sources.However, wide variations exist between areas of residence[11]. One in four people living in rural communities in Ghana do not have access to an improved and dependable water source[11]. There are many challenges that families face in their pursuit to access improved water. The daily need to fetch water, which includes walking long distances, takes time away from both family and productive activities. Often, it is women and young girls who bear the brunt of this work. When clean safe water sources are not available, households and communities rely on nearby unprotected streams, wells, rivers and springs where the quality and safety of the water cannot be guaranteed[11]. As a result, families and communities become susceptible to diarrhoea and other diseases that have a negative impact on community health and productivity[12, 13].The factors that determine sources of domestic water used by households in rural southern Ghana are investigated below. Method This paper analyzes socio-demographic factors of 100,634 heads of households from the 2 districts that By the end of 2011, 89% of the world population used an improved drinking-water source, and 55% enjoyed the convenience and associated health benefits of a piped supply on their premises [6]. An estimated 768 million people did not use an improved source for drinking-water in 2011, this included 185 million who relied on surface water to meet their daily drinking- water needs [6]. Urban drinking-water coverage has remained high over the past two decades. Of the 2.1 billion people who have gained access to improved sources of drinking-water since 1990, 83% of the population without access to an improved drinking- water source lived in rural areas by the end of 2011[6]. Over 70% of the global progress made in access to improved sources of drinking-water has been achieved through gaining access to piped drinking-water on premises[6]. A joint WHO/UNICEF report on progress on sanitation and drinking-water approximately 2.4 billion people – one-third of the warned that @ IJTSRD | Available Online @ www.ijtsrd.com | Volume – 1 | Issue – 5 | July-Aug 2017 Page: 1198
International Journal of Trend in Scientific Research and Development (IJTSRD) ISSN: 2456-6470 formed the catchment area of the Dodowa Health and Demographic Surveillance System from 2006 to 2013. The surveillance system has been following households and individuals in the two districts (Ningo-Prampram and Shai-Osudoku districts) located in southern Ghana since 2005. Univariable and multivariable associations between the household’s socio-demographic factors and their primary source of water were also explored using logistic regression. Study Area Data for this study were extracted from the Dodowa Health and Demographic Surveillance System (DHDSS) site database. The DHDSS is located in the south-eastern part of Ghana and operates within the boundaries of the Shai-Osudoku and Ningo- Prampram districts[14]. The DHDSS site lies between latitude 5° 45′ south and 6° 05′ north and longitude 0° 05′ east and 0° 20′ west. It is approximately 41 km from the national capital, Accra[14-16].The two districts carry a population of 115,754 people in 380 communities in 23,647 households covering a total land area of 1,442 square kilometres. The inhabitants are predominantly subsistence farmers, fishermen and vendors[15, 16]. Road networks in the DHDSS are usually inaccessible during the wet seasons, making access to health and other services a challenge. The districts have 22km of the Lower Volta River running through them, the river continues along the Northern boundary to the Eastern boundaries. The rainfall pattern is bimodal with a major rainy season between April and June and a minor rainy season in September. The average temperature and humidity are 29oC and 75%, respectively [14]. The main economic activities undertaken in the districts are subsistence farming, fishing and vending [14-16]. Fishing activities are concentrated along the bank of the Volta River in the north and along a 37km stretch on the coastline of the Gulf of Guinea in the south [14]. Study Population The study population comprised of household heads that were resident in the DHDSS from the 1st January 2011 to 31st December 2013. Ethical Consideration Data collection procedures and the quality assurance of DHDSS were approved by the Ethical Committee of Ghana Health Service, Institutional Review Board of Dodowa Health Research Centre (DHRC) and INDEPTH Network. The use of data for this study was authorized by management of DHRC and no identifying information was used. Outcome and Eposure Variables The outcome variable for this study is type of domestic water, which is binary recorded as: 1 “improved” and 0“uniproved”.From the available data, six (6) exposure variables were selected which were based on available literature and the potential to influence the type of domestic water used by households. These explanatory variables include: gender of household head, level of education, occupation, marital status, household size, and socioeconomic status (wealth index). The wealth index is a proxy measure of a household’s long term standard of living; it is based on social status, asset ownership, and availability of utilities, among others. The index measures were combined into a wealth index, using weights derived through principal component analysis (PCA)[17]. The proxies from the PCA were divided into five quintiles; poorest, very poor, poor, less poor and least poor. Results Table 1 provides the descriptive information on the socio-demographic characteristics of the study participants. The majority of the study participants (59.85%) were males while 40.15% were females. The majority of the study participants (75.18%) were of Ga-Dangme ethnic group while 15.46% were Ewes. The other ethnic groups contributed very small proportions to the ethnic make-up of the study participants. Just over a third of the participants (36.97%) had no education, 35.44% had junior secondary school education and 14.38% and 13.16% had senior secondary and primary school levels of education respectively. While farmers, traders and artisans contributed 47.43%, 17.28% and 14.57% of the occupation categories categories of occupation contributed only smaller proportions. While half of the study participants were The DHDSS visits every household in the demographic surveillance area twice per annum to collect data on demographic, migratory and other health indicators[15, 16]. Health care service in the DHDSS is provided by hospitals, health centres, CHPS zones, private facilities, clinics, maternity homes, mission clinics and quasi government clinics. respectively, other @ IJTSRD | Available Online @ www.ijtsrd.com | Volume – 1 | Issue – 5 | July-Aug 2017 Page: 1199
International Journal of Trend in Scientific Research and Development (IJTSRD) ISSN: 2456-6470 married (48.95%), 28.70% and 12.93% were co- habiting and widowed respectively and 9.42% were single. The majority of the participants (67.99%) had a household of less than five (5) members and 32.01% had a household size equal to five or more. While more than half of the households studied (58.26%) use piped water outside their homes, 16.17% and 12.22% of them depend on piped water in their homes and rivers, lakes or ponds respectively as their main source of domestic water as shown in figure 1. Combinations 2.46% Others 0.18% Rain Water 0.09% Tanker services 5.04% Well/Borehole 5.58% Pipe at home 16.17% River/Lake/Pon d 12.22% Pipe outside home 58.26% Figure 1: Distribution of source of water used by household The results revealed that a high proportion of households (74.44%) in the study area have access to improved sources of water. Figure 2 show that there has been a significant increase in the use of improved sources of water by households between the years 2006 and 2013. @ IJTSRD | Available Online @ www.ijtsrd.com | Volume – 1 | Issue – 5 | July-Aug 2017 Page: 1200
International Journal of Trend in Scientific Research and Development (IJTSRD) ISSN: 2456-6470 14,000 y = 1114.7x + 4348 R² = 0.9585 12,000 Number of Households 10,000 8,000 6,000 4,000 2,000 0 2006 2007 2008 2009 2010 2011 2012 2013 Years Improved Unimproved Linear (Improved) Figure 2: Distribution of type of domestic water used by households each year Table 1: Socio-demographic characteristics of study participants Characteristics Frequency Gender Female 40400 Male 60234 Ethnicity Ga-Dangme 75654 Akan 5026 Ewe 15563 Northern 3831 Other 560 Education No education 37209 Primary 13247 Junior secondary school 35668 Senior secondary school and above Others 39 Occupation Unemployed 5994 Farmer 47729 Proportion (%) 40.15 59.85 75.18 4.99 15.46 3.81 0.56 36.97 13.16 35.44 14.38 14471 0.04 5.96 47.43 @ IJTSRD | Available Online @ www.ijtsrd.com | Volume – 1 | Issue – 5 | July-Aug 2017 Page: 1201
International Journal of Trend in Scientific Research and Development (IJTSRD) ISSN: 2456-6470 Artisan 14662 Trader 17389 Civil servant 5161 Fisherman 5402 Other 4297 Marital status Single 9480 Married 49259 Cohabiting 28879 Widowed 13016 Household size Less than five 68426 Equal to five or more 32208 14.57 17.28 5.13 5.37 4.27 9.42 48.95 28.7 12.93 67.99 32.01 Table 2 shows the adjusted and unadjusted odd ratio of determinants of unimproved source of water used by households. The results show that the gender of the household head is significantly associated with the use of unimproved sources of water by households such that, male headed households are 96% less likely to use unimproved sources of water compared to female headed households in the unadjusted model (OR: 0.96, 95%CI:0.93-0.99). In the adjusted model, gender is still significantly associated with a household’s use of unimproved sources of water such that male headed households are 11% more likely to use unimproved sources of water (OR:1.11, 95%CI: 1.07-1.15) after adjusting for level of education, occupation, marital status, household size and socioeconomic status. Household heads’ level of education is significantly associated with the type of water used in the household such that, the odds of using unimproved sources of water reduces with the increasing level of education of the household head. Household heads with Primary, Junior High School (JHS), and Senior High School (SHS) levels and above of education are 80%, 66%, and 38% less likely to used unimproved sources of water respectively compared with those with no education (OR:0.80, 95%CI:0.77-0.84, OR:0.66, 93%CI:0.64-0.69, OR: 0.38,95%CI:0.36-0.40). The same pattern of significant association between household heads’ level of education and unimproved sources of domestic water is observed after adjusting for other explanatory variables as indicated in Table 2. The results further showed that, in the adjusted and the unadjusted model, the occupation of the household head is significantly associated with the type of domestic water used by households. In the unadjusted model, household heads who are married, cohabiting and widowed are 36%, 17% and 14%, more likely to use unimproved sources of water compared to those who are single respectively (OR:1.36, 95%CI:1.29-1.43, OR:1.17, 95%CI:1.11-1.24, OR:1.14, 95%CI:1.07-1.21). After adjusting for other explanatory variables, married household heads are 19% more likely to have their households use unimproved sources of water (OR: 1.19, 95%CI: 1.12-1.25) while widowed household heads are 85% less likely to used unimproved sources of water (OR: 0.85, 95%CI: 0.80-0.91) compared to household heads who are single. The results further showed that, households with sizes of five (5) or more are 18% more likely to use unimproved sources of water compared to those with sizes of less than five (OR:1.18, 95%CI:1.15-1.22) in the unadjusted model. After adjusting for other explanatory variables, household size is associated with the use of unimproved sources of water used such that a household size of five or more are 3% less likely to use unimproved sources of water compared to a size of less than five (OR:1.03,95%CI:1.00-1.07). Furthermore, household socioeconomic status is significantly associated with type of domestic water used such that the odds of using unimproved sources of water by households are reduced with increasing socioeconomic status. Households in the poorer socioeconomic status are 13% more likely to use unimproved sources of water compared to those in the poorest category in the unadjusted model (OR: 1.13, 95%CI: 1.08-1.18). Households @ IJTSRD | Available Online @ www.ijtsrd.com | Volume – 1 | Issue – 5 | July-Aug 2017 Page: 1202
International Journal of Trend in Scientific Research and Development (IJTSRD) ISSN: 2456-6470 in the poor, less poor, and least poor categories are 85%, 43% and 23% less likely to use unimproved sources of water compared to those in the poorest category (OR:0.85,95%CI:0.82-0.89, OR:0.43, 95%CI:0.41-0.46, OR:0.23, 95%CI:0.22-0.25) respectively. Finally, after adjusting for gender, education, occupation, marital status and household size, the household socioeconomic status is significantly associated with the type of domestic water used. While poorer households are 15% more likely to use unimproved sources of water (OR: 1.15, 95%CI: 1.10-1.20), poor, less poor and least poor households are 91%, 41%, and 28% less likely to use unimproved source of water respectively compared to those in the poorest category (OR: 0.91, 95%CI: 0.87-0.95, OR: 0.49, 95%CI: 0.46-0.51, OR: 0.25, 95%CI: 0.26-0.30). Table 2: Unadjusted and adjusted odd ratios of determinants of unimproved sources of domestic water used by households Characteristics Unadjusted OR P-Value (95% CI) Gender Female 1.00 Male 0.96 0.009 (0.93 - 0.99)† Education No Education 1.00 Primary 0.80 <0.001 (0.77 - 0.84)† Junior secondary school 0.66 <0.001 (0.64 - 0.69)† Senior secondary school and above Other 0.18 0.005 (0.06 - 0.59)† Occupation Unemployed 1.00 Farmer 1.95 <0.001 (1.82 - 2.08)† Artisan 1.01 0.885 (0.93 - 1.09) Trader 1.28 <0.001 (1.19 - 1.38)† Civil servant 0.72 <0.001 (0.65 - 0.80)† Fisherman 0.85 0.001 (0.77 - 0.94)† Other 1.25 <0.001 (1.14 - 1.38)† Marital status Single 1.00 Married 1.36 <0.001 (1.29 - 1.43)† Cohabiting 1.17 <0.001 (1.11 - 1.24)† Widowed 1.14 <0.001 (1.07 - 1.21)† Household size Less than five 1.00 Equal to five or more 1.18 <0.001 (1.15 - 1.22)† Socio Economic Status Poorest 1.00 Poorer 1.13 <0.001 (1.08 - 1.18)† Poor 0.85 <0.001 (0.82 - 0.89)† Less Poor 0.43 <0.001 (0.41 - 0.46)† Least Poor 0.23 <0.001 (0.22 - 0.25)† Adjusted OR 1.00 1.11 <0.001 (1.07 - 1.15)† 1.00 0.87 <0.001 (0.83 - 0.91)† 0.83 <0.001 (0.80 - 0.86)† 0.68 <0.001 (0.64 - 0.72)† P-Value (95% CI) 0.38 <0.001 (0.36 - 0.40)† 0.41 0.143 (0.13 - 1.35)† 1.00 1.62 <0.001 (1.51 - 1.74)† 1.25 <0.001 (1.15 - 1.35)† 1.25 <0.001 (1.16 - 1.34)† 1.31 <0.001 (1.18 - 1.46)† 0.87 0.006 (0.79 - 0.96)† 1.55 <0.001 (1.40 - 1.71)† 1.00 1.19 <0.001 (1.12 - 1.25)† 1.00 0.977 (0.94 - 1.06) 0.85 <0.001 (0.80 - 0.91)† 1.00 1.03 0.043 (1.00 - 1.07)† 1.00 1.15 <0.001 (1.10 - 1.20)† 0.91 <0.001 (0.87 - 0.95)† 0.49 <0.001 (0.46 - 0.51)† 0.28 <0.001 (0.26 - 0.30)† @ IJTSRD | Available Online @ www.ijtsrd.com | Volume – 1 | Issue – 5 | July-Aug 2017 Page: 1203
International Journal of Trend in Scientific Research and Development (IJTSRD) ISSN: 2456-6470 Discussion The finding that 80.22% households had access to improved sources of water in 2013 is comparable to the national figures of 80%, 76.4% and 75.3% reported by other studies in 2011, 2010 and 2000 respectively[11, 18, 19]. A significant proportion of households (12.22%) still depends on rivers, lakes, or ponds as their main source of water which is an increase of 4.2% from the 8% that was reported in the 2010 Ghana Population and Housing Census (PHC). [18]. study in Niger where it was found that the rich are more likely to have piped water in their residences[31]. The finding is similar to a study in Jordan which reported that household income is a significant predictor of per capita water demand [32]. In Ghana, a significant statistical relationship between income and access to safe/portable water has been established[33]. However, our result diverges with another Ghanaian study which established a significant inverse relationship between income and improved water source[34]. The finding of this paper which suggests that male headed households are more likely to use unimproved source of water conforms with a Cameroon study [20] but contravened the finding of other studies[21-24] which suggested that female-headed households may not have the money, resources, power, or confidence to ensure that their improved water needs are met. The major strength of this study is the use of data from the Health and Demographic Surveillance System which longitudinally follows-up the entire population of the study area [15] hence the generalizability of the findings to the whole population. Conclusion Although households’ access to improved water increased from 64.43% in 2006 to 80.22% in 2013, a significant proportion (12.22%) still depends on rivers, lakes, or ponds as their main source of domestic water. Socio-demographic factors of household heads (gender, level of education, occupation, marital status, household size, and socioeconomic status) are strong determinants of the type of domestic water used by households in rural settings in Ghana. The significant association between household heads level of education and type of water source used by households in this study conforms with the findings of other studies [24-28]as higher educational attainment leads to the higher socioeconomic status of household heads which is closely linked with the affordability of services such as water from improved sources by households. The significant association between occupation of household head and the type of water used by households has also been established by other studies[24, 26]. The occupation of the household head may influence the households income and hence the amount of money available to spend on water. Future social interventions in the study area must be aimed at bridging the gap between the poor and least poor households and to improving the level of education in these communities is recommended. There is a statistically significant association between household size and the use of improved sources of water. This relationship has been highlighted in other studies [20, 29]. Abbreviations CI: confidence intervals; DHDSS: Dodowa Health and Demographic Surveillance System; DHRC: Dodowa Health Research Centre; JHS: Junior High School; JMP: Joint Monitoring Programme; MDGs: Millennium Development Goals; OR: Odd Ratio; PHC: Population and Housing Census; SHS: Senior High School; UNICEF: United Nations Children’s Fund; WHO: World Health Organization. Declarations Ethical consideration The Ethical Committee of Ghana Health Service, Institutional Review Board of Dodowa Health Research Centre (DHRC) and INDEPTH Network approved the operation and the data collection The study found a significant association between household head’s marital status and the type of water used by a household. This finding is similar to another study which found marital status to be a significant determinant of farmers’ choice of water source in Nigeria[30]. Household socioeconomic status which is a proxy for ability-to-pay is a significant determinant of the type of water used in households. Higher socioeconomic status reduces the odds of a household’s use of unimproved water sources. This is consistent with a @ IJTSRD | Available Online @ www.ijtsrd.com | Volume – 1 | Issue – 5 | July-Aug 2017 Page: 1204
International Journal of Trend in Scientific Research and Development (IJTSRD) ISSN: 2456-6470 procedure of the DHDSS. The researchers briefed each respondent as well as their household heads about the HDSS data collection process. Participating individuals and households in the DHDSS gave their consent prior to the interview during each round of data collection and those who refused to give consent were excluded. Names and other unique identifiers of the study participants were not included in the extracted data to maintain confidentiality. Permission to use the data was obtained from management of DHRC. information over the years. The authors are grateful to Rachel Makoni and all those who read this manuscript for their helpful comments. REFERENCE 1)Sharma NP, Damhaug T, Gilgan-Hunt E: African water resources: challenges and opportunity for sustainable development. World Bank Technical paper. In. Washington, DC: The World Bank; 1996. 2)Arouna A, Dabbert S: Determinants of domestic water use by rural households without access to private improved water sources in Benin: A Seemingly Unrelated Tobit approach. Water Resources Management 2009. 3)United Nations Development Group: Indicators for Monitoring the Millenium Development Goals. In. New York, NY, USA,: United Nations; 2003. 4)World Health Organisation, UNICEF: Joint Monitoring Programme for Water Supply and Sanitation. Progress Drinking-Water: 2010 Update. In. Geneva, Switzerland: World Health Organization; 2010. 5)Bain R, Cronk R, Wright J, Yang H, Slaymaker T, Bartram J: Fecal contamination of drinking- water in low-and middle-income countries: a systematic review and meta-analysis. PLoS Med 2014, 11(5). 6)World Health Organization, UNICEF: Progress on sanitation and drinking-water-2013 update. In. Geneva; 2013. 7)Kenya National Bureau of Statistics: Kenya Demographic and Health Survey 2008-09. In. KNBS and ICF Macro: Calverton, Maryland 2010. 8)Moss J, Wolf G, Gladden G, Guttieriez E: Shifting Paradigm: Towards a new economy of water for food and ecosystem. In. Osaka, Japan; 2003. 9)WHO: The World Health Report. In: Reducing Risks, Promoting Healthy Life. Geneva; 2002. 10)Bhargava V.: Global issues for global citizens; An introduction to key development challenges. In. Washington, DC: World Bank; 2006. 11)Ghana Statistical Service: Ghana Multiple Indicator Cluster Survey with an Enhanced Malaria Module and Biomarker. In: Final Report. Accra, Ghana; 2011. 12)Handzel T, Karanja D, Addiss DG, Hightower AW, Rosen DH: Geographic distribution of Consent to publish This article used secondary aggregated data which does not include any individual persons data hence consent to publish is not applicable. Availability of data and material Due to participant confidentially and the ethical policies of the Dodowa Health Research Centre, we are unable to make the dataset publically available. Competing interests The authors declare that they have no competing interests. on Sanitation and Funding The Dodowa Health and Demographic Surveillance System has no core funding. It is supported through on-going projects at the Dodowa Health Research Centre such as INDEPTH Effectiveness and Safety Studies (INESS)through the INDEPTH Network, Ghana’s Ensure Mothers and Babies Regular Access to Care (EMBRACE) program, and Rectal Artesunate and Malaria Pneumonia study through WHO/TDR. Authors’ contributions All authors have read and approved the manuscript. AK Manyeh: Participated in the conceptualization, and design of the research idea, data extraction, conducted the literature introductory section, analysis, interpretation, the results and discussion. DEA: Provided statistical support and reviewed the manuscript. SB: Was involved in literature manuscript. review, wrote the review and reviewed Acknowledgements We appreciate the hard work and commitment of the data and the field team of the Dodowa Health and Demographic Surveillance System. We are thankful to the opinion leaders and residents in the surveillance area for offering their time for interviews and consistently sharing their valuable personal @ IJTSRD | Available Online @ www.ijtsrd.com | Volume – 1 | Issue – 5 | July-Aug 2017 Page: 1205
International Journal of Trend in Scientific Research and Development (IJTSRD) ISSN: 2456-6470 schistosomiasis and soil-transmitted helminths in Western Kenya: implications for anthelminthic mass treatment. Am J Trop Med Hyg 2003, 69:318–323. 13)Stothard JR, French MD, Simba Khamis I, Basa´n˜ez MG, Rollinson D: The epidemiology and control of urinary schistosomiasis and soil- transmitted helminthiasis in schoolchildren on Unguja Island, Zanzibar. Trans R Soc Trop Med Hyg 2009, 103:1031–1044. 14)Awini E, Sarpong D, Adjei A, Manyeh KA, Amu A, Akweongo P, Adongo P, Kukula V, Odonkor G, Narh S et al: Estimating cause of adult (15+ years) death using InterVA-4 in rural districts of southern Ghana. Global Health Action 2014, 7. 15)Gyapong M, Sarpong D, Awini E, Manyeh KA, Tei D, Odonkor G, Agyepong IA, Mattah P, Wontuo P, Attaa-Pomaa M et al: HEALTH AND DEMOGRAPHIC SURVEILLANCE SYSTEM PROFILE: The Dodowa HDSS. International Journal of Epidemiology 2013, 42:1686-1696. 16)Manyeh KA, Kukula V, Odonkor G, Ekey AR, Adjei A, Narh-Bana S, Akpakli ED, Gyapong M: Socioeconomic and demographic determinants of birth weight in southern rural Ghana: evidence from Dodowa Health and Demographic Surveillance System. BMC Pregnancy and Childbirth 2016, 16:160. 17)Vyas S, Kumaranayake L: Constructing socio- economic status indices: how to use principal components analysis. Health Policy Plan 2006, 21(6):459-468. 18)Osei-Assibey E, Grey SK: 2010 Population and housing census report. In: Millennium development goals in Ghana. Accra, Ghana: Ghana Statistical Service; 2013. 19)Ghana Statistical Service: 2000 Population and Housing Census Report. In. Accra, Ghana; 2000. 20)Luc ATF, Fondo S: Determinants of the houses' choice of drinking water source in Cameroom.Journal of Sustainable Development in Africa 2012, 14(3):1520-5509. 21)Mbugua W: The African Family and the Status of Women’s Health. London; 1997. 22)Oppong C: The African family and the status of women’s health. In.; 1997. 23)World Bank: Gender and Poverty in India. In. Washington: The World Bank; 1991. 24)Koskei EC, Koskei RC, Koske MC, Koech HK: Effect of Socio-economic Factors on Access to Improved Water Sources and Basic Sanitation in Bomet Municipality, Kenya. Research Journal of Environmental and Earth Sciences, 2013, 5(12):714-719. 25)Dungumaro EW: Socioeconomic differentials and availability of domestic water in South Africa. J Phys Chem Earth 2007, 32(15-18):1141- 1147. 26)Lawrence P, Meigh J, Sullivan C: The Water Poverty Index: An International Comparison. . Keele Economics Research Papers 2002. 27)Abebaw D, Tadesse F, Mogues T: Access to Improved Water Source and Satisfaction with Services Evidence from Rural Ethiopia In: International Food Policy Research Institute Discussion Paper 01044. edn.; 2010. 28)Armand LFT, Fondo S, Ibrahim A: Household Choice of Purifying Drinking Water in Cameroon. Environmental Management and Sustainable Development 2012, 1(2):2164-7682. 29)Briand A, Nauges d’approvisionnement en eau des ménages de Dakar: Une étude économétrique à partir de données d’enquête. Revue d’Economie du Développement 2009(3):83-108. 30)Nkang NM, Omonona BT, Ibana SE: Modelling Water Demand and Use Behaviour of Dry Season Waterleaf Cultivators in Calabar, Nigeria: A Discrete Choice Approach. J Agri Soc Sci 2006, 2(4). 31)Bardasi E, Wodon Q: Who Pays the Most for Water? Alternative Providers and Service Cost in Niger. Economics Bulletin 2008, 9(20):1-10. 32)Iskandarani M: Economics of Household Water Security in Jordan, Development Economics and Policy. In., edn. Edited by Peter Lang, Frankfurt am Main; 2002: 32. 33)Asante FA: Economic Decentralization in Development Economics and Policy. edn. Edited by Peter Lang, Frankfurt am Main; 2003: 32. 34)Osei-Asare Y: Household Water Security and Water Demand in the Volta Basin of Ghana. European University Studies, 2005, 3152. Choix C, M. T: (Talinum triangulare) Analysis Ghana. of In: Rural @ IJTSRD | Available Online @ www.ijtsrd.com | Volume – 1 | Issue – 5 | July-Aug 2017 Page: 1206