NASA Earth Observing System Data and Information Systems
230 likes | 396 Vues
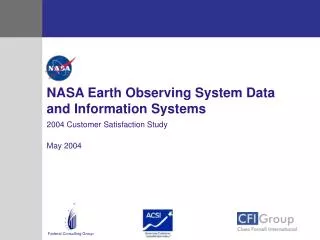
NASA Earth Observing System Data and Information Systems. 2004 Customer Satisfaction Study May 2004. Snapshot of the American Customer Satisfaction Index (ACSI). The #1 national economic indicator of customer satisfaction

NASA Earth Observing System Data and Information Systems
E N D
Presentation Transcript
NASA Earth Observing System Data and Information Systems 2004 Customer Satisfaction Study May 2004
Snapshot of the American Customer Satisfaction Index (ACSI) • The #1 national economic indicator of customer satisfaction • Compiled by the National Quality Research Centerat University of Michigan Since 1994 usingmethodology licensed from CFI Group • Measures 40 industries, 200 organizations covering 75% of the U.S. economy • Over 70 U.S. Federal Government agencies have used ACSI to measure more than 120 programs/services • Advanced methodology quantifiably measures and links satisfaction levels to performance and prioritizes actions for improvement
Raise trust in your agency and the government overall Enable Senior Executive Service members to meet performance criteria Identify areas for improving quality of service provided to customers Provide critical information for annual performance plans to Congress (as required under GPRA) Link customer satisfaction with expectations and desired outcomes Customer Satisfaction Set “baseline” for customer satisfaction and measure progress Benchmark against “best” in business and government Why Should Agencies Measure Customer Satisfaction?
EXAMPLE 0.8 Component 1 76 ACSI 79 1.2 Component 2 Impact 65 Score Review of ACSI Results • A component score is a weighted average of the set of survey questions comprising a component or activity area. Responses to survey questions are given on a 1-10 scale, which is converted to a 0-100 scale for score reporting. • An impact predicts the increase in satisfaction that would result from a 5-point increase in a component or input score. • Areas for improvement are those components or activities with a relatively low score and a relatively high impact on satisfaction. In the simplified example shown here, Component 2 would be a key action area due to its relatively low score and high impact.
Project Background • Which NASA EOSDIS customer segment was surveyed? This customer segment includes individuals who have accessed NASA EOSDIS data and/or products by means of a NASA EOSDIS Data Center (DAAC). • How were the NASA EOSDIS customers identified? • NASA EOSDIS provided a list of 33,251 email addresses for people who have used NASA EOSDIS data and/or products. A sample drawn from the list, and CFI Group sent out 9,999 email invitations asking customers to participate in the online survey. • The survey was available online April 29, 2004 – May 19, 2004. A total of 1,056 surveys were completed, of which CFI Group used 1,016 surveys for analysis.
NASA EOSDIS Results • The Customer Satisfaction Index for NASA EOSDIS is… 75* NASA EOSDIS Aggregate Segment • The Customer Satisfaction Index score is derived from customer responses to three questions in the survey: • How satisfied are you overall with the products and services provided by the Data Center (79)? • To what extent have the data, products and services provided by the Data Center fallen short of or exceeded your expectations (73)? • How well does the Data Center compare with an ideal provider of scientific data, products and services (71)? • This score is four points higher than the 2003 American Customer Satisfaction Index for the Federal Government overall (71). *The confidence interval for ACSI is +/-1.1 for the aggregate at the 95% confidence level.
Comparison Across Government Agencies Customer Satisfaction Index • While NASA EOSDIS performs well when compared to the Federal Government overall, it doesn’t perform as well when compared to other information providing agencies.
Outcomes Quality Components (Drivers) ACSI Product Search 70 0.8 Product Customer Selection Complaints and Order 1.1 32% 73 0.6 Customer 0.5 Satisfaction 2.5 Delivery Future Use (ACSI) 84 90 75 3.5 0.9 Product Recommend Quality 86 1.0 68 Customer Support 84 NASA EOSDIS Customer Satisfaction Model
Summary of Findings • Product Quality is the lowest scoring component (68), and has a relatively high impact (0.9). • All attributes in this area received similar ratings • At 84 Customer Support scores well, but is also high impact (1.0). • There is a significant difference in Customer Support ratings given by customers within the U.S. (88) compared to those outside the U.S. (82). • The components Product Search and Product Selection and Order are highly correlated. • Recent customers are more satisfied, but are also reporting more problems. • Percent of Customer Complaints is fairly high (32%) when compared to the Federal Government overall (12%). • Customers may not be calling to complain about a problem, but rather to seek assistance in solving the problem. • 90% of respondents who answered the Customer Complaint questions gave user services’ complaint handling a rating of “6” or above.
In what format were data or products provided? HDF-EOS 49% HDF 39% NetCDF 5% Binary 14% ASCII 12% GeoTIFF 19% Other 7% Was documentation… Delivered with the data 44% Pointed to (on a website) 41% Not available 15% Product QualityImpact: 0.9
DeliveryImpact: 0.5 66% of customers’ data was delivered through FTP
Desired Outcomes • NASA EOSDIS wants its customer to recommend and use EOSDIS services in the future. Desired customer behaviors were measured with a single question each. • “How likely are you to recommend the Data Center to a colleague?” scored an 86 (Impact of CSI onto Recommend: 3.5.) • “How likely are you to use the services provided by the Data Center in the future?” scored a 90 (Impact of CSI onto Future Use: 2.5.) • NASA EOSDIS customers were also asked if they had ever contacted the Data Center’s user services office to report a problem. • 32% of of customer say they have contacted the Data Center’s user services office to report a problem.
Score ComparisonTime of Last Data Product or Service Request
Score ComparisonCurrent Location 10 point difference in the score for “timeliness of response”
Recommendations • Focus on Product Quality. • Review the type of data product documentation available with each product. Work to improve the clarity and thoroughness of the documentation. • Assess the various data formats and work to improve the usability of each. • Offer a wider variety of data formats. • Review the Product Search and Product Selection and Order scores to determine how best to help customers find the data they need. • Due to high correlation, improvements in one area will likely result in improvements in the other. • Simplify the search process; make data products more apparent. • Improve data product descriptions.
Additional Information • Detailed survey results for all of the Federal services, including trends in performance and customer satisfaction, were updated in December 2003 and can be found on the website www.customerservice.gov. • Many agencies share best practices through the interagency customer service forum.