Download
1 / 21
210 likes | 228 Vues
Explore advancements in observational archives, data stewardship, and metadata analysis to enhance climate data quality and usability. Address key questions and recommendations for improving climate observing systems.

E N D
Panel 4: Data and observing system issues, including changes in observing system Chair: Kevin Trenberth Panel: Data issues: Steve Worley (not available; provided some slides) Dave Easterling Bias corrections and ERA-40 experience Saki Uppala (extra time: ERA40 experience) Bob Kistler (not available) OSEs and more Bob Atlas
Datasets for Climate System StudiesSteven Worley, August 2003, NCAR • Observational Archives • Archive Enhancements from Reanalyses • Archive Access
Observational Archives • Rescue old data • International exchanges • Data Stewardship • Basic Quality Control • Station Library Improvements • Verify station locations and elevations • Maintain irreplaceable data in perpetuity • Data for Reanalyses • Improvements for the records • Collaborate on Reanalysis input preparation
DSS archive improvements from ERA40 • Improvements are based on harvesting Reanalysis metadata added to the input data records (feedback data) • e.g. Quality Mark, Suspect • Need ECMWF and DSS collaboration to understand metadata meaning – create or collect good documentation! • Analyze and use the metadata for two purposes: • fix outstanding systematic problems in the data or station libraries • provide ERA40 metadata information to future data users • Aids for improvements on feedback data (future?) • Label with datasets ID and version number • Label with station library version number • Add other data QC attributes • Add reanalysis model usage metadata to source archives as: • Results – improved records
Archive Access • Observations, metadata, station libraries • Newest versions and documentation online via web and ftp • Reanalysis data products • Multiple access methods • Native GRIB software for all data • Conversion software for scientific applications • Most readily user friendly, e.g. NetCDF, GIS
Some Key Questions: Datasets: How to track and continue to improve? Changing data bases: How do we deal with changing radiosondes and satellite data? What is the utility of OSEs? Should they be done routinely every time a new observation suite is introduced? How much emphasis should be placed on improving model biases? Should the climate relax to a recent known climate rather than model climate (e.g. for ozone in pre-sat times) Do we need a better baseline network of observations that have guaranteed and known accuracy?
Comparisons between SnowWhite and Hygristors in RS80-H and NWS/VIZ Reference Sonde: GPS receiver interfering with airflow. Smaller/longer duct, Smaller intake No response Slow response NWS/VIZ: Larger/shorter duct, Larger intake Operational sondes not responsive for humidity below about –20C
Comparisons between SnowWhite and RS80-H Cirrus Operational radiosondes not responsive for humidity below about –20C
Water vapor trends over Boulder CO 1981-2000 % long-term mean Shaded region is 95% confidence region Based on balloon-borne frost-point hygrometer flown about 1/month. HALOE satellite occultations for 1991-2000 also show positive trends above 25 km but not below. Causes of differences not well understood. From Scientific Assessment of Ozone Depletion: 2002
Water vaporis the most important greenhouse gas. Its changes in the upper troposphere are especially important for climate change. Yet such changes are extremely poorly known. Trends in the Boulder record and HALOE disagree. We urgently need at least two other stations to complement the Boulder station: one in the deep Tropics, (say Singapore where the QBO is best monitored), and one in the Southern Hemisphere mid latitudes (say Lauder, New Zealand – where there is an ozonesonde). Further: There is an urgent need for a sparse true baseline sonde network with better temporal sampling than these. GUAN is not working well. Regular radiosondes are not good enough. Reference sonde? Better to have fewer but better and more reliable about every 4 days (the decorrelation time between independent T samples).
Water vapor sampling can also be addressed by GPS columnmeasurements and the diurnal cycle is an important issue. Constrains total. It is desirable to also get a better handle on H2O in the upper troposphere, perhaps through programs like IHOP. The NOAA frostpoint hygrometer soundings are believed to cost $2,500 for the expendables; the prototype reference sonde at NCAR is about $2,000 for expendables (maybe $1,500 in bulk), vs $67 for a regular sonde (Vaisala RS90) and $120 to $150 for new replacement sondes. My Recommendation: Akin to surface climate Ref Network: Establish a new global baseline network of radiosondes built around regular flights of “reference sondes” every 4 days. 40 stations@$2K*90 = $7M/year
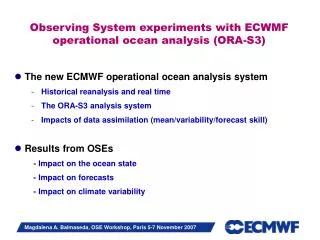
Working Group 3: Trends in Observations and Analyses Issues for trends and low frequency variability: The ERA-40 has the goal of producing the best set of analyses given the observations available. The key advantage is the synthesis of all available observations. However, this creates a dependency on the observing system. 8 Nov 2002
Issues for trends and low frequency variability: • Model bias • Analysis tends to revert to model climate in absence of data • Real trends • SSTs and radiative gases; • But not total solar irradiance, aerosols, land use change • Changes in observing systems • Perturbations (like Pinatubo) While some trends may be captured by the observing system and can be reflected in other quantities through the dynamics, in general the null hypothesis should be that trends and low frequency variability are more likely to be spurious unless proven otherwise.
Observing System Changes: • In situ:SSTs (1982), Pibals, Aircraft, etc • Radiosondes • Types, instruments, locations, times, coverage • Satellite data • 1972: VTPR • 1973: some cloud tracked winds • 1979: TOVS (HIRS, MSU, SSU); TOMS, SBUV (ozone) • 1987: SSMI (sfc winds, column water vapour) • 1992: ERS scatterometer • 1998: ATOVS • Satellites vary in number,have finite lifetimes • and are replaced every few years. There is • orbital decay, change in times, platform heating • and instrument degradation • These require bias corrections
Problems occurred in ECMWF ERA-15 • in assimilating satellite data • Spurious variability: cloud clearing problems e.g. 1980 • Spurious changes: satellite transitions and bad data • Only 1 satellite: 1986-87 • 2 Nov 1986: solar flare interference • February 1989: change in satellites From Trenberth, Hurrell, Fiorino, Stepaniak. 2001 J. Climate
TOVS/ATOVS for ERA-40 S A T E L L I T E S U P P L I E R NOAA-16
Example: Satellite based observations • Satellites typically last 3-5 years and have to be replaced • Orbits decay • Equator crossing times change • New satellite orbits differ • Instrument calibrations drift and can be changed by launch • Interference can occur from other instruments • Need is for stable orbits • May require boosters • Need sufficient sampling of diurnal cycle • Launch on schedule, not on failure, to ensure overlap • Calibrations required • Ground truth validation required
Bias Corrections are Needed • But how good are they? • Is there a baseline to establish real trends? • Bias corrections should be applied to satellite • and radiosonde data. • Potential for unintended perturbations or bad data • to be perpetuated. • There is evidence from alpine summitobservations • that spurious trends may exist. • Most radiosonde stations do NOT have adequate records • of changes Need to document bias correction changes to all observing systems.
Is there a baseline to establish real trends? • Closest to a baseline, but still unsatisfactory is the • GUAN (Global Upper Air Network) of designated • radiosonde stations • More complete records • Independent analyses • Better metadata • Changes in instruments likely to be abrupt change • Track performance with “Feedback file” • Validate ERA-40 • Improve GUAN More generally: Extract subset of feedback file for all radiosonde stations (emphasis on GUAN), and make available
Track system performance viz a viz trends • Use independent measures and constraints • Global mass of dry air • Surface air temperature over land in selected regions • Dobson ozone measurements • SAGE data (water vapor) • Ocean wave measurements • Alpine summit station data • Time series of forecast performance measures • “Satellite temperatures” MSU 2 and 4 • GEWEX and SPARC datasets and reports • e.g. ISCCP clouds, etc • Other measurements: • Surface observations, River discharge, Glaciers (?) • Time series of background and analysis fits to observations • Recommendation: • Document these issues and communicate them • and the results of the studies to users.
Recommendations: • 1. Carry out an ensemble of AMIP-type model simulations • with the available forcings to establish the model climate • and its natural variability. • 2. Carry out selected OSEs with and without major new • observing components (planned already) • Such as 1973 (VTPR), 1979 (TOVS), 1987 (SSMI) • 3. Carry out a series of OSEs to assess overall gradual • changes in observing system by utilizing results from • a recent year (1998-2000) and degrading the observing • system to match that of: • Late 1950s (include simulated weather ship obs) • Mid 1970s (include simulated VTPR from HIRS) • Mid 1980s • For different seasons