Download
1 / 26
260 likes | 515 Vues
Using Ocean Observing Systems & Real Time Data to monitor and clean up Oil Spills. Ocean Observing Systems. From Ocean.us. Ocean Observing Systems. As a system, the components provide: Continuous data sets High quality, accurate data through concurrent measurement by many components

E N D
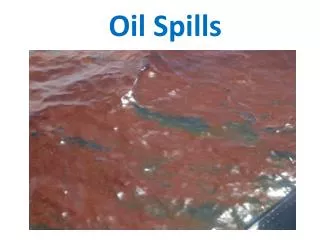
Using Ocean Observing Systems & Real Time Data to monitor and clean up Oil Spills
Ocean Observing Systems From Ocean.us
Ocean Observing Systems As a system, the components provide: • Continuous data sets • High quality, accurate data through concurrent measurement by many components • Means of collecting data without immediate human presence • Means of collected valuable data during dangerous conditions like storm events (see #3) From Ocean.us
Ocean Observing Systems • Continuous data sets are important because they: • Show the entire big picture, not just small pieces of information here and there • Provide large amounts of quality data to input into forecast models From Ocean.us So not only do scientists use ocean observing system data to see where spilled oil is now, but also to forecast where it is going!
Remotely Operated Vehicles Some of the first images we saw after the Deepwater Horizon incident were from Remotely Operated Vehicles, or ROVs From the AP *Note the ROV’s claw in the center of the picture
Remotely Operated Vehicles From NOAA
Autonomous Underwater Vehicles (AUVs) Gliders Fetch From Rutgers Coastal Ocean Observation Lab (COOL) REMUS From Mark Patterson, VA Institute of Marine Science From Office of Naval Research
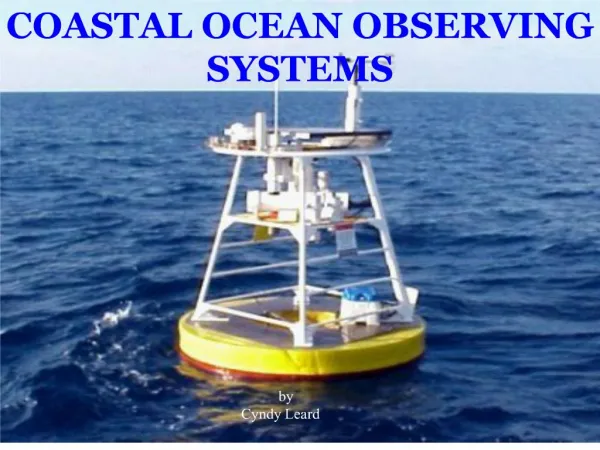
Buoys Equipped with sensors that can measure: • Air & water temperature • Wind speed & direction • Water current speed & direction • Wave height & period • Atmospheric pressure …and more
Buoys From Gulf of Maine Ocean Observing System (GoMOOS)
Buoys From Gulf of Maine Ocean Observing System (GoMOOS)
Satellites Satellite photos and data-images were, and will continue to be, integral in the monitoring and clean up of the Gulf oil spill From NASA From NASA
Satellites From National Geographic Taken on 4/21/2010. You can see the burning oil rig and smoke moving to the southeast.
Satellites From National Geographic Taken 4/25/10. Oil slick as seen from NASA satellite.
Satellites From NASA Satellite image of sea surface currents as measured using sea surface altimetry. The Loop Current can be seen in larger vectors and faster speeds.
High Frequency (HF) Radar 5 MHz Transmit Antennas • Originally designed to track submarines during WWII • Now used to measure surface water currents’ speed and direction 25 and 13 MHz Receive Antenna From J. Kohut; Rutgers Coastal Ocean Observation Lab (COOL)
High Frequency (HF) Radar Transmit Antenna Receiver Antenna Picture from IOOS. Arrows added.
Air-deployed Drifting Buoys From Horizon Marine
Argo Floats From Argo
Argo Floats From Argo
Aircraft-mounted sensors NASA’s Airborne Visible/Infrared Imaging Spectrometer (AVIRIS) is used to map the occurrence, amount, thickness and condition of surface oil in the Gulf of Mexico. Credit: NASA DFRC Top: NASA ER-2 aircraft, on which AVIRIS was mounted. Bottom: Labeled figure of AVIRIS. Right: AVIRIS map of Louisiana coast and surface oil. Credit: NASA/JPL-Caltech/Dryden/USGS/UC Santa Barbara
On-site Research Vessels NOAA R/V Henry B. Bigelow. From nola.com. NOAA R/V Gordon Gunter. From NOAA. NOAA R/V Pisces. Credit: NOAA. NOAA R/V Nancy Foster. Credit: NOAA.