Download
1 / 14
140 likes | 278 Vues
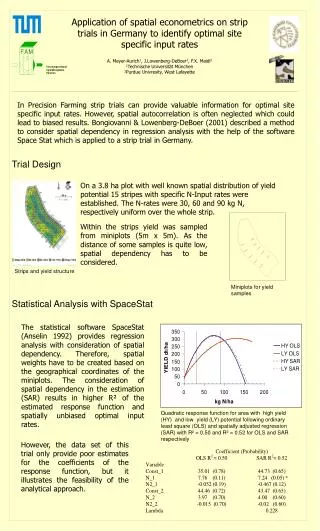
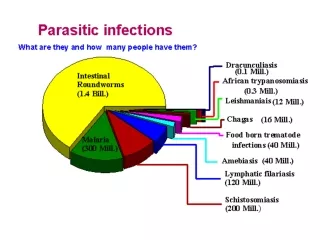
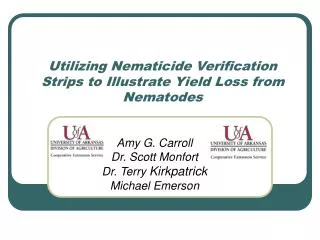
Utilizing Nematicide Verification Strips to Illustrate Yield Loss from Nematodes. Amy G. Carroll Dr. Scott Monfort Dr. Terry Kirkpatrick Michael Emerson. Economics of Nematodes in Arkansas (2006). Estimated yield losses = 5.5 % of total cotton production

E N D
Utilizing Nematicide Verification Strips to Illustrate Yield Loss from Nematodes Amy G. Carroll Dr. Scott Monfort Dr. Terry Kirkpatrick Michael Emerson
Economics of Nematodes in Arkansas (2006) Estimated yield losses = 5.5 % of total cotton production Two important Nematodes in Arkansas Meloidogyne incognita Rotylenchulus reniformis Meloidogyne incognita (Root-knot nematode) Estimated 3.0 % Rotylenchulus reniformis (Reniform nematode) Estimated 2.5 %
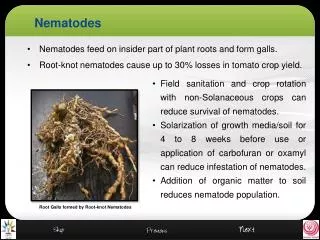
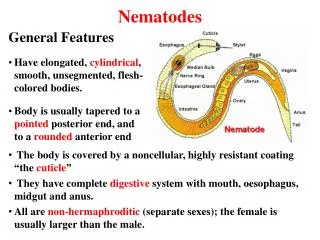
Nematode Symptoms Galls on roots ---Root-knot Stunting Chlorosis Abnormal root growth Severely stressed plants may die Kirkpatrick and Rothrock, 2001
Study Objective Educate producers on root-knot nematode related damage in cotton Utilize Precision Ag Technologies to demonstrate the within field variation in in yield loss due to root-knot nematode infection and soil parameters
Methods At each location: Strip comparisons Nematicide Soil Fumigant Treated (Telone, Dow AgroSciences) 3 gal/A rate Untreated At least 3 replications of the strip comparisons Yield was recorded with a Agleader Yield Monitor Spatial maps created in SST Development GIS Software --- SSToolbox
Trt UnTrt UnTrt UnTrt Trt Trt Strip Yield Average Treated = 939 lbs/A Untreated = 879 lbs/A
Technology Used Multi-Spectral Imagery was acquired throughout the season Veris Data was taken at Pre-Plant Yield Data was Collected at Harvest
Heavy Soil Sandy Soil Shallow Veris Map 1 to 12 inches
Heavy Soil Sandy Soil Deep Veris Map 12 to 36 inches
Verification Strip Demo Yield Data for Entire Field
Trt = 842 lbs/A (a) UnTrt = 961 lbs/A (a) Trt = 995 lbs/A (a) UnTrt = 893 lbs/A (b) 102 lbs/A Trt = 1002 lbs/A (a) UnTrt = 1005 lbs/A (a) Trt = 1021 lbs/A (a) UnTrt = 1034 lbs/A (a) Trt = 848 lbs/A (a) UnTrt = 712 lbs/A (b) 136 lbs/A Trt = 767 lbs/A (a) UnTrt = 674 lbs/A (a) Trt = 924 lbs/A (a) UnTrt = 776 lbs/A (b) 148 lbs/A Average Yield Data from Zones Based on Soil Types
Conclusion Response to nematicide application was more effective on sandy soil types than heavier soil types. This site-specific approach has the potential to reduce the amount of chemical required Technology to do this and readily available to all farmers.
Special Thanks Mr. James Thomas Wildy Farm Bonds Farm Dow AgroSciences