Application of Spatial Econometrics in German Strip Trials for Optimal Input Rates
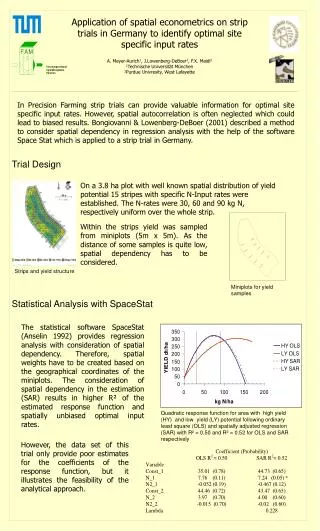
This study explores the application of spatial econometrics on strip trials in Germany to identify optimal site-specific input rates. Utilizing the SpaceStat software, the research considers spatial autocorrelation often overlooked in traditional analyses. A trial was conducted on a 3.8 ha plot with 15 strips of varying nitrogen (N) input rates. The results indicate that including spatial dependency leads to more accurate estimations of input rates. The findings emphasize the importance of spatial analysis for better precision farming decisions and the potential for improved yield estimations.

Application of Spatial Econometrics in German Strip Trials for Optimal Input Rates
E N D
Presentation Transcript
Application of spatial econometrics on strip trials in Germany to identify optimal site specific input rates A. Meyer-Aurich1, J.Lowenberg-DeBoer2, F.X. Maidl11Technische Universität München2Purdue Univresity, West Lafayette In Precision Farming strip trials can provide valuable information for optimal site specific input rates. However, spatial autocorrelation is often neglected which could lead to biased results. Bongiovanni & Lowenberg-DeBoer (2001) described a method to consider spatial dependency in regression analysis with the help of the software Space Stat which is applied to a strip trial in Germany. Trial Design On a 3.8 ha plot with well known spatial distribution of yield potential 15 stripes with specific N-Input rates were established. The N-rates were 30, 60 and 90 kg N, respectively uniform over the whole strip. Within the strips yield was sampled from miniplots (5m x 5m). As the distance of some samples is quite low, spatial dependency has to be considered. Strips and yield structure Miniplots for yield samples Statistical Analysis with SpaceStat The statistical software SpaceStat (Anselin 1992) provides regression analysis with consideration of spatial dependency. Therefore, spatial weights have to be created based on the geographical coordinates of the miniplots. The consideration of spatial dependency in the estimation (SAR) results in higher R² of the estimated response function and spatially unbiased optimal input rates. Quadratic response function for area with high yield (HY) and low yield (LY) potential following ordinary least square (OLS) and spatially adjusted regression (SAR) with R² = 0.50 and R² = 0.52 for OLS and SAR respectively However, the data set of this trial only provide poor estimates for the coefficients of the response function, but it illustrates the feasibility of the analytical approach.
Topography and grids on Plot A20 (Soilinformationsystem of FAM, http://www.gsf.de/FAM/bis.html) Research Association on Agroecosystems Munich (FAM) The Research Association on Agroecosystems Munich is located at research institutions of the Technical University of Munich and the National Research Centre for Environment and Health GSF in Bavaria, Germany. It investigates sustainable land use forms and analyzes the impact of land use systems on the agroecosystem Research site of FAM “Klostergut Scheyern” All over the research site soil data were recorded on a 50m x 50m grid to investigate the heterogeneity of the soil. Since 1994 yield data were measured with yield monitors for wheat, corn and potato.
Potato harvester with yield monitor system on the FAM research station Conclusions The analysis of yield data from precision farming should consider spatial dependency, because otherwise biased results might lead to wrong conclusions. SpaceStat can serve as a tool to integrate spatial dependence in regressions and can help to find optimal input rates from strip trials. However, in order to get reliable estimates for optimal input rates more input rates should be tested. Furthermore a greater set of yield data could improve the estimates. In future calculations data from GPS- based yield monitors will be considered. References: Anselin, L 1992. SpaceStat Tutorial. A Workbook for Using SpaceStat in the Analysis of Spatial Data. Department of Agricultural and Consumer Economics, University of Illinois at Urbana-Champaign. Bongiovanni, R. & Lowenberg-DeBoer, 2001. Precision Agriculture: Economics of Nitrogen Management in Corn Using Site-specific Crop Response Estimates from a Spatial Regression Model. Paper on AAEA Meeting 2001 in Chicago. Contact: Andreas Meyer-Aurich, Technische Universität München, Chair of Agricultural Economics, D-85350 Freising-Weihenstephan Email:ameyer@wzw.tum.de