Download
1 / 1
10 likes | 124 Vues
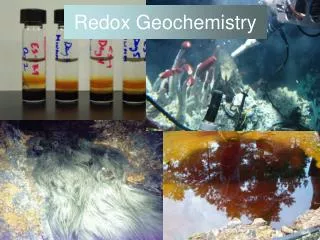
Explore the geochemistry and texture of argillaceous hydrocarbon source rocks using La vs. Zr and Mo vs. Corg diagrams to compare Utica and Marcellus shales. Uncover natural gas potential and carbonate-rich features. Study K2O/Na2O ratios and shale Nd model ages for New York State formations.

E N D
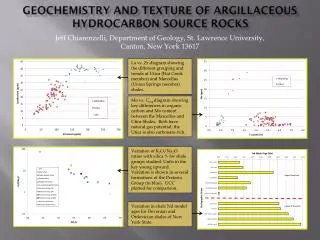
Geochemistry AND TEXture of Argillaceous Hydrocarbon Source Rocks La vs. Zr diagram showing the different grouping and trends of Utica (Flat Creek member) and Marcellus (Union Springs member) shales. Mo vs. Corgdiagram showing key differences in organic carbon and Mo content between the Marcellus and Utica Shales. Both have natural gas potential; the Utica is also carbonate-rich. Jeff Chiarenzelli, Department of Geology, St. Lawrence University, Canton, New York 13617 Variation of K2O/Na2O ratios with silica % for shale groups studied. Units in the key young upward. Variation is shown in several formations of the Pretoria Group (in blue). UCC plotted for comparison. Variation in shale Nd model ages for Devonian and Ordovician shales of New York State.