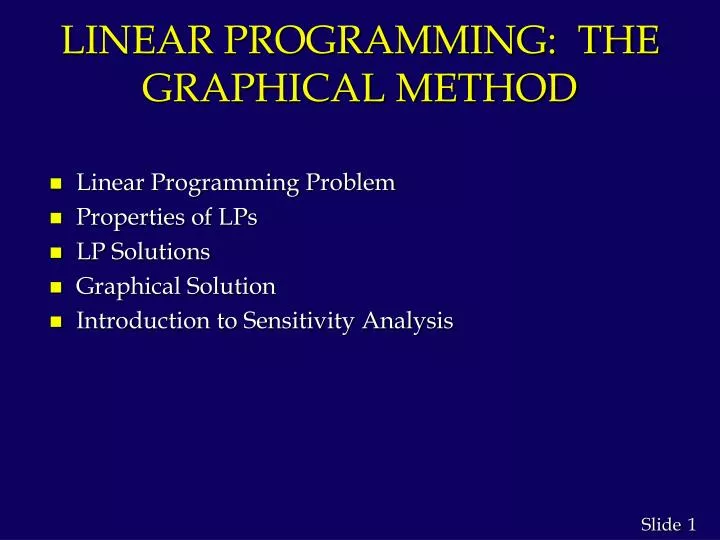
LINEAR PROGRAMMING: THE GRAPHICAL METHOD
LINEAR PROGRAMMING: THE GRAPHICAL METHOD. Linear Programming Problem Properties of LPs LP Solutions Graphical Solution Introduction to Sensitivity Analysis. Linear Programming (LP) Problem.

LINEAR PROGRAMMING: THE GRAPHICAL METHOD
E N D
Presentation Transcript
LINEAR PROGRAMMING: THE GRAPHICAL METHOD • Linear Programming Problem • Properties of LPs • LP Solutions • Graphical Solution • Introduction to Sensitivity Analysis
Linear Programming (LP) Problem • A mathematical programming problem is one that seeks to maximize or minimize an objective function subject to constraints. • If both the objective function and the constraints are linear, the problem is referred to as a linear programming problem. • Linear functions are functions in which each variable appears in a separate term raised to the first power and is multiplied by a constant (which could be 0). • Linear constraints are linear functions that are restricted to be "less than or equal to", "equal to", or "greater than or equal to" a constant.
Building Linear Programming Models • 1. What are you trying to decide - Identify the decision variable to solve the problem and define appropriate variables that represent them. For instance, in a simple maximization problem, RMC, Inc. interested in producing two products: fuel additive and a solvent base. The decision variables will be X1 = tons of fuel additive to produce, and X2 = tons of solvent base to produce. • 2. What is the objective to be maximized or minimized? Determine the objective and express it as a linear function. When building a linear programming model, only relevant costs should be included, sunk costs are not included. In our example, the objective function is: z = 40X1 + 30X2; where 40 and 30 are the objective function coefficients.
Building Linear Programming Models • 3. What limitations or requirements restrict the values of the decision variables? Identify and write the constraints as linear functions of the decision variables. Constraints generally fall into one of the following categories: • a. Limitations - The amount of material used in the production process cannot exceed the amount available in inventory. In our example, the limitations are: • Material 1 = 20 tons • Material 2 = 5 tons • Material 3 = 21 tons available. • The material used in the production of X1 and X2 are also known.
Building Linear Programming Models • To produce one ton of fuel additive uses .4 ton of material 1, and .60 ton of material 3. To produce one ton of solvent base it takes .50 ton of material 1, .20 ton of material 2, and .30 ton of material 3. Therefore, we can set the constraints as follows: .4X1 + .50 X2 <= 20 .20X2 <= 5 .6X1 + .3X2 <=21, where .4, .50, .20, .6, and .3 are called constraint coefficients. The limitations (20, 5, and 21) are called Right Hand Side (RHS). • b. Requirements - specifying a minimum levels of performance. For instance, production must be sufficient to satisfy customers’ demand.
Properties of LPs • Proportionality The profit contribution and the amount of the resources used by a decision variable is directly proportional to its value. • Additivity The value of the objective function and the amount of the resources used can be calculated by summing the individual contributions of the decision variables. • Divisibility Fractional values of the decision variables are permitted.
LP Solutions • The maximization or minimization of some quantity is the objective in all linear programming problems. • A feasible solution satisfies all the problem's constraints. • Changes to the objective function coefficients do not affect the feasibility of the problem. • An optimal solution is a feasible solution that results in the largest possible objective function value, z, when maximizing or smallest z when minimizing. • In the graphical method, if the objective function line is parallel to a boundary constraint in the direction of optimization, there are alternate optimal solutions, with all points on this line segment being optimal.
LP Solutions • A graphical solution method can be used to solve a linear program with two variables. • If a linear program possesses an optimal solution, then an extreme point will be optimal. • If a constraint can be removed without affecting the shape of the feasible region, the constraint is said to be redundant. • A nonbinding constraint is one in which there is positive slack or surplus when evaluated at the optimal solution. • A linear program which is overconstrained so that no point satisfies all the constraints is said to be infeasible.
LP Solutions • A feasible region may be unbounded and yet there may be optimal solutions. This is common in minimization problems and is possible in maximization problems. • The feasible region for a two-variable linear programming problem can be nonexistent, a single point, a line, a polygon, or an unbounded area. • Any linear program falls in one of three categories: • is infeasible • has a unique optimal solution or alternate optimal solutions • has an objective function that can be increased without bound
Slack and Surplus Variables • A linear program in which all the variables are non-negative and all the constraints are equalities is said to be in standard form. • Standard form is attained by adding slack variables to "less than or equal to" constraints, and by subtracting surplus variables from "greater than or equal to" constraints. • Slack and surplus variables represent the difference between the left and right sides of the constraints. • Slack and surplus variables have objective function coefficients equal to 0.
Example: Graphical Solution • Solve graphically for the optimal solution: Min z = 5x1 + 2x2 s.t. 2x1 + 5x2> 10 4x1 - x2> 12 x1 + x2> 4 x1, x2> 0
Example: Graphical Solution • Graph the Constraints Constraint 1: When x1 = 0, then x2 = 2; when x2 = 0, then x1 = 5. Connect (5,0) and (0,2). The ">" side is above this line. Constraint 2: When x2 = 0, then x1 = 3. But setting x1 to 0 will yield x2 = -12, which is not on the graph. Thus, to get a second point on this line, set x1 to any number larger than 3 and solve for x2: when x1 = 5, then x2 = 8. Connect (3,0) and (5,8). The ">" side is to the right. Constraint 3: When x1 = 0, then x2 = 4; when x2 = 0, then x1 = 4. Connect (4,0) and (0,4). The ">" side is above this line.
Example: Graphical Solution • Constraints Graphed x2 Feasible Region 5 4 3 2 1 4x1 - x2> 12 x1 + x2> 4 2x1 + 5x2> 10 1 2 3 4 5 6 x1
Example: Graphical Solution • Graph the Objective Function Set the objective function equal to an arbitrary constant (say 20) and graph it. For 5x1 + 2x2 = 20, when x1 = 0, then x2 = 10; when x2= 0, then x1 = 4. Connect (4,0) and (0,10). • Move the Objective Function Line Toward Optimality Move it in the direction which lowers its value (down), since we are minimizing, until it touches the last point of the feasible region, determined by the last two constraints. This is called the Iso-Value Line Method.
Example: Graphical Solution • Objective Function Graphed Min z = 5x1 + 2x2 4x1 - x2> 12 x1 + x2> 4 x2 5 4 3 2 1 2x1 + 5x2> 10 1 2 3 4 5 6 x1
Example: Graphical Solution • Solve for the Extreme Point at the Intersection of the Two Binding Constraints 4x1 - x2 = 12 x1+ x2 = 4 Adding these two equations gives: 5x1 = 16 or x1 = 16/5. Substituting this into x1 + x2 = 4 gives: x2 = 4/5 • Solve for the Optimal Value of the Objective Function Solve for z = 5x1 + 2x2 = 5(16/5) + 2(4/5) = 88/5. Thus the optimal solution is x1 = 16/5; x2 = 4/5; z = 88/5
Example: Graphical Solution Min z = 5x1 + 2x2 4x1 - x2> 12 x1 + x2> 4 x2 5 4 3 2 1 2x1 + 5x2> 10 Optimal: x1 = 16/5 x2 = 4/5 1 2 3 4 5 6 x1
Sensitivity Analysis • Sensitivity analysis is used to determine effects on the optimal solution within specified ranges for the objective function coefficients, constraint coefficients, and right hand side values. • Sensitivity analysis provides answers to certain what-if questions.
Range of Optimality • A range of optimality of an objective function coefficient is found by determining an interval for the objective function coefficient in which the original optimal solution remains optimal while keeping all other data of the problem constant. The value of the objective function may change in this range. • Graphically, the limits of a range of optimality are found by changing the slope of the objective function line within the limits of the slopes of the binding constraint lines. (This would also apply to simultaneous changes in the objective coefficients.) • The slope of an objective function line, Max c1x1 + c2x2, is -c1/c2, and the slope of a constraint, a1x1 + a2x2 = b, is -a1/a2.
Shadow Price • A shadow price for a right hand side value (or resource limit) is the amount the objective function will change per unit increase in the right hand side value of a constraint. Mathematically, the shadow price is the rate of improvement in the objective value per unit increase in a constraint right hand side(RHS). Economically, the shadow price measures the marginal benefit of having one additional unit of a scarce resources. Therefore, depending on the cost per unit of the limited resource, you use the shadow price to decide whether to buy one additional unit of that resource.
Shadow Price • Graphically, a shadow price is determined by adding +1 to the right hand side value in question and then resolving for the optimal solution in terms of the same two binding constraints. • The shadow price is equal to the difference in the values of the objective functions between the new and original problems. • The shadow price for a nonbinding constraint is 0. A constraint is nonbinding if its constraint limit is not reached (we have more of that resource than required).
Dual Price • A dual price for a right hand side value (or resource limit) is the amount the objective function will improve per unit increase in the right hand side value of a constraint. • For maximization problems dual prices and shadow prices are the same. • For minimization problems, shadow prices are the negative of dual prices.
Range of Feasibility • The range of feasibility for a change in the right hand side value is the range of values for this coefficient in which the original shadow price remains constant. • Graphically, the range of feasibility is determined by finding the values of a right hand side coefficient such that the same two lines that determined the original optimal solution continue to determine the optimal solution for the problem.
Example: Sensitivity Analysis • Solve graphically for the optimal solution: Max z = 5x1 + 7x2 s.t. x1< 6 2x1 + 3x2< 19 x1 + x2< 8 x1, x2> 0
Example: Sensitivity Analysis • Graphical Solution x2 x1 + x2< 8 8 7 6 5 4 3 2 1 1 2 3 4 5 6 7 8 9 10 Max 5x1 + 7x2 x1< 6 Optimal x1 = 5, x2 = 3 z = 46 2x1 + 3x2< 19 x1
Example: Sensitivity Analysis • Range of Optimality for c1 The slope of the objective function line is -c1/c2. The slope of the first binding constraint, x1 + x2 = 8, is -1 and the slope of the second binding constraint, x1 + 3x2 = 19, is -2/3. Find the range of values for c1 (with c2 staying 7) such that the objective function line slope lies between that of the two binding constraints: -1 < -c1/7 < -2/3 Multiplying through by -7 (and reversing the inequalities): 14/3 <c1< 7
Example: Sensitivity Analysis • Range of Optimality for c2 Find the range of values for c2 ( with c1 staying 5) such that the objective function line slope lies between that of the two binding constraints: -1 < -5/c2< -2/3 Multiplying by -1: 1 > 5/c2> 2/3 Inverting, 1 <c2/5 < 3/2 Multiplying by 5: 5 <c2< 15/2
Example: Sensitivity Analysis • Shadow Prices Constraint 1: Since x1< 6 is not a binding constraint, its shadow price is 0. Constraint 2: Change the RHS value of the second constraint to 20 and resolve for the optimal point determined by the last two constraints: 2x1 + 3x2 = 20 and x1 + x2 = 8. The solution is x1 = 4, x2 = 4, z = 48. Hence, the shadow price = znew - zold = 48 - 46 = 2.
Example: Sensitivity Analysis • Shadow Prices (continued) Constraint 3: Change the RHS value of the third constraint to 9 and resolve for the optimal point determined by the last two constraints: 2x1 + 3x2 = 19 and x1 + x2 = 9. The solution is: x1 = 8, x2 = 1, z = 47. Hence, the shadow price is znew - zold = 47 - 46 = 1.
Example: Infeasible Problem • Solve graphically for the optimal solution: Max z = 2x1 + 6x2 s.t. 4x1 + 3x2< 12 2x1 + x2> 8 x1, x2> 0
Example: Infeasible Problem • There are no points that satisfy both constraints, hence this problem has no feasible region, and no optimal solution. x2 2x1 + x2> 8 8 4x1 + 3x2< 12 4 x1 3 4
Example: Unbounded Problem • Solve graphically for the optimal solution: Max z = 3x1 + 4x2 s.t. x1 + x2> 5 3x1 + x2> 8 x1, x2> 0
Example: Unbounded Problem • The feasible region is unbounded and the objective function line can be moved parallel to itself without bound so that z can be increased infinitely. x2 3x1 + x2> 8 8 x1 + x2> 5 5 Max 3x1 + 4x2 x1 2.67 5