Diagnostic Value of Biomarker Panel in Systemic Juvenile Idiopathic Arthritis
70 likes | 158 Vues
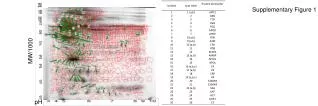
This study evaluates a 7-member biomarker panel comprising A2M, APOA1, CRP, HP, S100A8/S100A9, SAA, and SAP for diagnosing Systemic Juvenile Idiopathic Arthritis (SJIA). The research involved training and testing sets, with the panel demonstrating high sensitivity and specificity in classifying SJIA cases. The predictive probabilities, agreement with clinical diagnosis, and AUC values further validate the efficacy of the biomarker panel in distinguishing SJIA from other conditions. The results highlight the potential of this panel in improving the diagnostic process for SJIA patients.

Diagnostic Value of Biomarker Panel in Systemic Juvenile Idiopathic Arthritis
E N D
Presentation Transcript
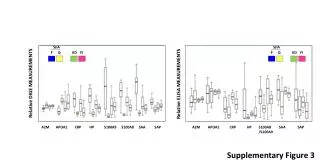
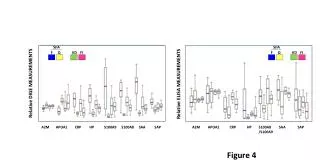
SJIA SJIA F Q KD FI F Q KD FI Relative DIGE MEASUREMENTS Relative ELISA MEASUREMENTS A2M APOA1 CRP HP S100A9 S100A8 SAA SAP A2M APOA1 CRP HP S100A8 /S100A9 SAA SAP Figure 4
C A B D Training set n = 24 Testing set n = 20 Training Testing SJIA • Biomarker panel • of 7 members • A2M • APO AI • CRP • HP • S100A8/S100A9 • SAA • SAP SJIA Clinical diagnosis Clinical diagnosis SJIA F SJIA Q SJIA F SJIA Q F Q F Q 12 12 10 10 n = n = LDA Testing Classified as F Classified as F 11 1 8 3 Predicted probabilities Classified as Q Classified as Q 1 11 2 7 91.6% 91.6% 80% 70% Percent Agreement with clinical diagnosis + - Percent Agreement with clinical diagnosis + - 91.6% 75% Overall P = 1.0 E -4 Overall P = 7 E -2 Patient samples P*= 9.6E -6 P*=4 E -3 Figure 5
E Training Set Testing Set Training + Testing Set Sensitivity Sensitivity Sensitivity ESR : AUC=0.86 ESR : AUC=0.96 ESR : AUC=0.92 S100A8/S100A9 : AUC=0.78 S100A8/S100A9 : AUC=0.73 S100A8/S100A9 : AUC=0.74 CRP : AUC=0.65 CRP : AUC=0.82 CRP : AUC=0.72 panel : AUC=0.82 panel : AUC=0.95 panel : AUC=0.94 1- Specificity 1- Specificity 1- Specificity Figure 5
D B C A Training set n = 23 Testing set n = 15 Training Testing POLY F vs. Q POLY POLY Clinical diagnosis Clinical diagnosis PF PQ PF PQ F Q F Q 13 10 10 5 n = n = Sensitivity LDA Testing Classified as F Classified as F 10 5 3 0 Predicted probabilities Classified as Q Classified as Q 3 5 7 5 76.9% 50% 30% 100% Percent Agreement with clinical diagnosis + - Percent Agreement with clinical diagnosis + - panel : AUC=0.64 65.2% 53.3% CRP : AUC=0.64 Overall P = 0.41 Overall P = 0.20 Patient samples 1- Specificity Supplementary Figure 5
A. B Training set n = 59 KD + FI SJIA F SJIA F KD FI KD + FI 22 10 27 SJIA F NOT SJIA F Clinical diagnosis 22 37 n = Sensitivity ESR : AUC=0.661 LDA Predicted probabilities S100A8/S100A9 : AUC=0.543 Classified as SJIA F 16 3 6 34 Classified as NOT SJIA F CRP : AUC=0.627 72.8% 91.9% Percent Agreement with clinical diagnosis + - panel : AUC=0.801 84.7% Overall P = 4.3E -7 1- Specificity Patient samples Figure 6
C B A QF QQ SJIA Clinical diagnosis QF QQ 5 10 Sensitivity n = LDA Predicted probabilities Classified as QF 4 0 Classified as QQ 1 10 ESR : AUC=0.68 80% 100% S100A8/S100A9 : AUC=0.74 Percent Agreement with clinical diagnosis + - CRP : AUC=0.82 93.3% panel : AUC=0.90 Overall P = 3.7 E -3 Patient samples 1- Specificity Figure 7