Download
1 / 6
60 likes | 178 Vues
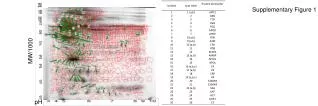
This supplementary figure presents a comprehensive analysis of protein concentrations associated with Systemic Juvenile Idiopathic Arthritis (SJIA). The data includes various biomarkers such as S100A8, S100A9, CRP, and others, measured across multiple pH levels and molecular weights. Key details include false discovery rates and significant feature counts that contribute to our understanding of SJIA pathophysiology. These findings underscore the potential of protein profiling in diagnosing and managing SJIA, highlighting the importance of specific proteins in inflammatory responses.

E N D
Supplementary Figure 1 MW/1000 pH
SJIA F Q C3 AGP1 ACT SAP SAA S100A8 S100A9 HP CRP C9 C4 APO-IV APO-L1 AMBP KLKB1 VDB CFH ATIII A2M ATIII APO-E APO-D FGG FGB TTR GSN APOA1 Figure 1
SJIA F Q ATIII C4 C9 SAA A2M PI MW PI MW PI MW PI MW PI MW 4.6 55K 5.9 75K 7.1 11K 5.3 160K 8.2 35K 4.7 55K 5.0 60K 5.5 14K 5.8 65K 5.3 55K 5.1 60K 8.5 35K 5.0 60K 5.2 60K 5.5 11K 4.9 160K 4.9 60K 6.3 44K 5.6 60K 6.0 11K 5.4 160K 4.8 60K 5.3 60K 4.0 17K 4.7 60K 6.7 11K 5.3 160K 5.4 60K Figure 2
POLY F Q SJIA SJIA SJIA A B F Q F KD F FI 0.30 0.25 TTR CFH 0.20 APO A1 A2M GSN False discovery rate (FDR) 0.15 C4 AGP1 ACT 0.10 APO IV SAP HP 0.05 CRP S100A8 S100A9 0.00 SAA 20 1 2 5 10 Number of features called significant P value: 1.1 E -4 P value: 0.5 P value: 0.19 P value: 1.4 E -4 Figure 3
12 10 8 Scale (normalized protein concentration (ug/ml)/mg) 6 S100A8/S1009 4 CRP HP SAA UCSD F UCSF F Stanford F UCSF Q Stanford Q 2 0 Supplementary Figure 2
A Goodness of class separation – D probability SJIA Training SJIA Testing Feature# 4 5 6 7 8 9 12 4 5 6 7 8 9 12 Figure 4


