Download

1 / 7
70 likes | 203 Vues
This study presents supplementary figures providing detailed analysis of normalized protein concentrations (µg/ml/mg) in subjects with Systemic Juvenile Idiopathic Arthritis (SJIA). Key proteins analyzed include S100A8, S100A9, HP, CRP, SAA, and various apolipoproteins. Results include significant findings related to proteins such as ATIII and CFH across different conditions. The data supports a deeper understanding of the biochemical landscape of SJIA, aiding in the development of diagnostic and therapeutic strategies.

E N D
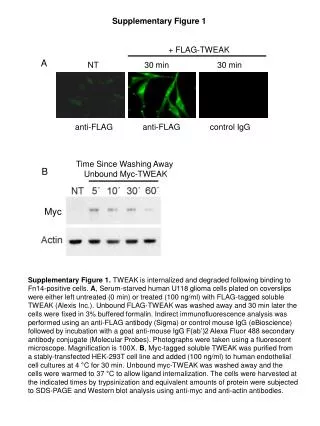
Supplementary Figure 1 MW/1000 pH
SJIA POLY Others F FI F KD Q Q C3 AGP1 ACT SAP SAA S100A8 S100A9 HP CRP C9 C4 APO-IV APO-L1 AMBP KLKB1 VDB CFH ATIII A2M ATIII APO-E APO-D FGG FGB TTR GSN APOA1 Figure 1
12 10 8 Scale (normalized protein concentration (ug/ml)/mg) 6 S100A8/S1009 4 CRP HP SAA UCSD F UCSF F Stanford F UCSF Q Stanford Q 2 0 Supplementary Figure 2
SJIA F Q ATIII C4 C9 SAA A2M PI MW PI MW PI MW PI MW PI MW 4.6 55K 5.9 75K 7.1 11K 5.3 160K 8.2 35K 4.7 55K 5.0 60K 5.5 14K 5.8 65K 5.3 55K 5.1 60K 8.5 35K 5.0 60K 5.2 60K 5.5 11K 4.9 160K 4.9 60K 6.3 44K 5.6 60K 6.0 11K 5.4 160K 4.8 60K 5.3 60K 4.0 17K 4.7 60K 6.7 11K 5.3 160K 5.4 60K Figure 2
SJIA POLY F Q F KD SJIA SJIA SJIA A B C F Q F KD F FI 0.30 0.25 TTR ATIII CFH 0.20 A2M APO A1 A2M HP GSN False discovery rate (FDR) 0.15 C4 APOIV AGP1 GSN ACT 0.10 APO IV APO A1 SAP HP SAA 0.05 CRP SAP S100A8 S100A9 0.00 AGP1 SAA 20 1 2 5 10 Number of features called significant P value: 1.1 E -4 P value: 0.5 P value: 0.19 P value: 1.4 E -4 P value: 2.9 E -4 Figure 3
Goodness of class separation – D probability SJIA Training SJIA Testing Feature# 4 5 6 7 8 9 12 4 5 6 7 8 9 12 Figure 3D