Download
1 / 29
290 likes | 444 Vues
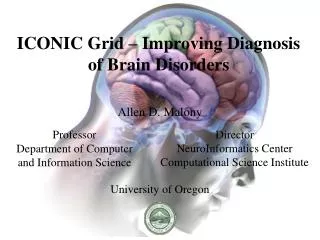
ICONIC Grid – Improving Diagnosis of Brain Disorders. Allen D. Malony University of Oregon. Professor Department of Computer and Information Science. Director NeuroInformatics Center Computational Science Institute. Outline. Brain, Biology, and Machine Initiative (BBMI) at UO

E N D
ICONIC Grid – Improving Diagnosis of Brain Disorders Allen D. Malony University of Oregon Professor Department of Computerand Information Science Director NeuroInformatics Center Computational Science Institute
Outline • Brain, Biology, and Machine Initiative (BBMI) at UO • Neuroinformatics research • Dynamic brain analysis problem • NeuroInformatics Center (NIC) at UO • Neuroinformatics technology and applications • Dense-array EEG and Electrical Geodesics, Inc. (EGI) • Epilepsy and pre-surgical planning (Dr. Frishkoff) • NIC research and development • ICONIC Grid HPC system at UO • IBM HPC solutions • HPC/Grid computing for Oregon’s science industry
Brain, Biology, and Machine Initiative • University of Oregon interdisciplinary research in cognitive neuroscience, biology, computer science • Human neuroscience focus • Understanding of cognition and behavior • Relation to anatomy and neural mechanisms • Linking with molecular analysis and genetics • Enhancement and integration of neuroimaging facilities • Magnetic Resonance Imaging (MRI) systems • Dense-array EEG system • Computation clusters for high-end analysis • Establish and support UO institutional centers
Brain Dynamics Analysis Problem • Understand functional activity of the human cortex • Different cognitive research neuroscience contexts • Multiple research, clinical, and medical domains • Multiple experimental paradigms and methods • Interpret with respect to physical and cognitive models • Requirements: spatial (structure), temporal (activity) • Imaging techniques for analyzing brain dynamics • Blood flow neuroimaging (PET, fMRI) • good spatial resolution functional brain mapping • temporal limitations to tracking of dynamic activities • Electromagnetic measures (EEG/ERP, MEG) • msec temporal resolution to distinguish components • spatial resolution sub-optimal (source localization)
good spatial poor temporal Cortical Activity Knowledge Base Head Analysis Source Analysis Structural / Functional MRI/PET spatial pattern recognition temporal dynamics Cortical Activity Model Experiment subject Constraint Analysis IndividualBrain Analysis Component Response Model neural constraints Dense Array EEG / MEG temporal pattern recognition Signal Analysis Response Analysis Component Response Knowledge Base poor spatial good temporal neuroimaging integration Integrated Dynamic Brain Analysis
Experimental Methodology and Tool Integration 16x256bits permillisec (30MB/m) CT / MRI segmentedtissues EEG NetStation BrainVoyager processed EEG mesh generation source localization constrained to cortical surface Interpolator 3D EMSE BESA
NeuroInformatics Center (NIC) at UO • Application of computational science methods to human neuroscience problems • Tools to help understand dynamic brain function • Tools to help diagnosis brain-related disorders • HPC simulation, large-scale data analysis, visualization • Integration of neuroimaging methods and technology • Need for coupled modeling (EEG/ERP, MR analysis) • Apply advanced statistical analysis (PCA, ICA) • Develop computational brain models (FDM, FEM) • Build source localization models (dipole, linear inverse) • Optimize temporal and spatial resolution • Internet-based capabilities for brain analysis services, data archiving, and data mining
Funding Support • BBMI federal appropriation • DoD Telemedicine Advanced Technology Research Center (TATRC) • $40 million research attracted by BBMI • $10 million gift from Robert and Beverly Lewis family • Established Lewis Center for Neuroimaging (LCNI) • NSF Major Research Instrumentation • “Acquisition of the Oregon ICONIC Grid for Integrated COgnitive Neuroscience Informatics and Computation” • New proposal • NIH Human Brain Project Neuroinformatics • “GENI: Grid-Enabled Neuroimaging Integration”
Electrical Geodesics Inc. (EGI) • EGI Geodesics Sensor Net • Dense-array sensor technology • 64/128/256 channels • 256-channel geodesics sensor net • AgCl plastic electrodes • Carbon fiber leads • Net Station • Advanced EEG/ERP data analysis • Stereotactic EEG sensor registration • Research and medical services • Epilepsy diagnosis, pre-surgical planning
Epilepsy • Epilepsy affects ~5.3 million people in the U.S., Europe, & Japan • EEG in epilepsy diagnosis • childhood and juvenile absence • idiopathic (genetic) • “generalized” or multifocal? • EEG in presurgical planning • fast, safe, inexpensive • 128/256 channels permit localization of seizure onset
EEG Methodology • Electroencephalogram (EEG) • EEG time series analysis • Event-related potentials (ERP) • Averaging to increase SNR • Linking brain activity to sensory–motor, cognitive functions (e.g., visual processing, response programming) • Signal cleaning (removal of noncephalic signal, “noise”) • Signal decomposition (PCA, ICA, etc.) • Neural Source localization
EEG Time Series - Progression of Absence Seizure First full spike–wave
Topographic Waveforms – First Full Spike-Wave 350ms interval
Topographic Mapping of Spike-Wave Progression • Palette scaled for wave-and-spike interval (~350ms) -130 uV (dark blue) 75 uV (dark red) • 1 millisecond temporal resolution is required • Spatial density (256ch) to capture shifts in topography
Animated Topography of Spike–Wave Dynamics • Spatial & Temporal Dynamics • Linked Networks • Fronto-thalamic circuit (executive control) • Limbic circuit (episodic memory) • Problem of Superposition • How many sources? • Where are they located?
Addressing Superposition: Brain Electrical Fields • Brain electrical fields are dipolar • Volume conduction depth & location indeterminacy • Highly resistive skull (CSF: skull est. from 1:40 to 1:80) • Left-hemisphere scalp field may be generated by a right-hemisphere source • Multiple sources superposition • Radial source Tangential sources • one and two sources varying depths
Source Localization • Mapping of scalp potentials to cortical generators • Signal decomposition (addressing superposition) • Anatomical source modeling (localization) • Source modelling • Anatomical Constraints • Accurate head model and physics • Computational head model formulation • Mathematical Constraints • Inverse solutions apply mathematical criteria such as “smoothness” (LORETA) to constrain the solution
Dipole Sources in the Cortex • Scalp EEG is generated in the cortex • Interested in dipole location, orientation, and magnitude • Cortical sheet gives possible dipole locations • Orientation is normal to cortical surface • Need to capture convoluted geometry in 3D mesh • From segmented MRI/CT • Linear superposition
Advanced Image Segmentation • Native MR gives high gray-to-white matter contrast • Image analysis techniques • Edge detection, edge merger, region growing • Level set methods and hybrid methods • Knowledge-based • After segmentation, color contrasts tissue type • Registered segmented MRI
Building Computational Brain Models • MRI segmentation of brain tissues • Conductivity model • Measure head tissue conductivity • Electrical impedance tomography • small currents are injectedbetween electrode pair • resulting potential measuredat remaining electrodes • Finite element forward solution • Source inverse modeling • Explicit and implicit methods • Bayesian methodology
Conductivity Modeling Governing Equations ICS/BCS Continuous Solutions Finite-DifferenceFinite-ElementBoundary-ElementFinite-VolumeSpectral Discretization System of Algebraic Equations Discrete Nodal Values TridiagonalADISORGauss-SeidelGaussian elimination Equation (Matrix) Solver (x,y,z,t)J (x,y,z,t)B (x,y,z,t) Approximate Solution
Alternating Direction Implicit (ADI) Method • Finite difference method • C++ and OpenMP on IBM p655 running Linux 305 seconds
Source Modeling with Standard Brain MRI Model Source model foranterior negative slow wave (100-200 ms) Source model forfirst medial positivewave (216-234 ms) Source model forsecond medial positive wave (256-308 ms)
UO ICONIC Grid • NSF Major Research Instrumentation (MRI) proposal • “Acquisition of the Oregon ICONIC Grid for Integrated COgnitive Neuroscience Informatics and Computation” • PIs • Computer Science: A. Malony, J. Conery • Psychology: D. Tucker, M. Posner, R. Nunnally • Senior personnel • Computer Science: S. Douglas, J. Cuny • Psychology: H. Neville, E. Awh, P. White • Computational, storage, and visualization infrastructure
ICONIC Grid graphics workstations interactive, immersive viz other campus clusters Internet 2 Gbit Campus Backbone CNI NIC NIC CIS CIS 4x8 16 16 2x8 2x16 SMP Server IBM p655 Shared Memory IBM p690 Graphics SMP SGI Prism Distributed Memory IBM JS20 Distributed Memory Dell Pentium Xeon TapeBackup SAN Storage SystemIBM SAN FS 5 Terabytes
ICONIC Grid Hardware p690 16 processors p655 4 nodes 8 processors per node FibreChannel FibreChannel FAStT storage 5 TB SAN FS Dell cluster 16 nodes 2 processors per node JS20 Blade 16 nodes 2 processors per node
raw … … virtual services storage resources compute resources Computational Integrated Neuroimaging System
Leveraging Internet, HPC, and Grid Computing • Telemedicine imaging and neurology • Distributed EEG and MRI measurement and analysis • Neurological medical services • Shared brain data repositories • Remote and rural imaging capabilities • Neet to enhance HPC and grid infrastructure in Oregon • Build on emerging web services and grid technology • Establish HPC resources with high-bandwidth networks • Create institutional and industry partnerships • Cerebral Data Systems (UO partnership with EGI) • Continue strong relationship with IBM and Life Sciences
Region 2 Internet 2 /National LambdaRail Region 1 Regional networks Region 5 Region 4 HPC servers Regional clients Oregon E-Science Grid Region 3