Impact of Caspase-12 Deficiency on Bacterial Clearance and Sepsis Resistance in Mice
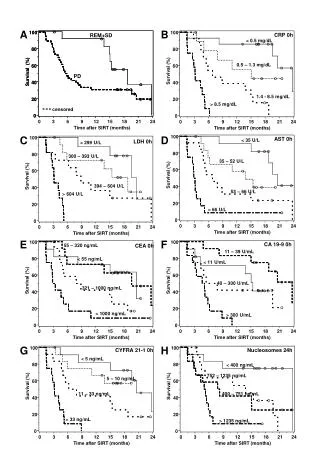
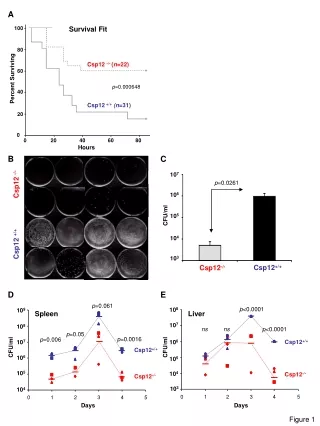
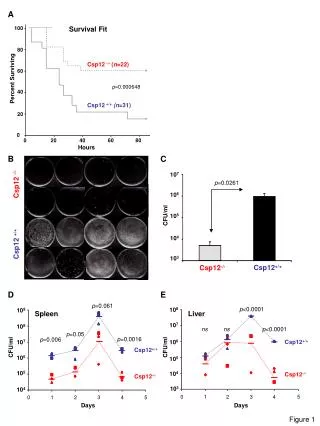
This study investigates the role of caspase-12 (Csp12) deficiency in enhancing bacterial clearance and improving survival rates in sepsis model mice. The findings reveal that Csp12-deficient mice exhibit significantly higher survival rates and bacterial clearance compared to their wild-type counterparts. Key experiments utilized various stimuli, including LPS and ATP, highlighting the differential expression of inflammatory cytokines IL-1β and TNF-α. Statistical analysis shows notable differences in survival and inflammatory responses, supporting a protective role for Csp12 deficiency in sepsis.

Impact of Caspase-12 Deficiency on Bacterial Clearance and Sepsis Resistance in Mice
E N D
Presentation Transcript
A Survival Fit 100 80 Csp12 -/- (n=22) 60 Percent Surviving p=0.000648 40 Csp12 +/+(n=31) 20 0 0 20 40 60 80 Hours B C 107 p=0.0261 Csp12 -/- 106 CFU/ml 105 104 Csp12 +/+ 103 Csp12+/+ Csp12-/- D E p=0.061 Days p<0.0001 108 109 Spleen Liver Liver Spleen 107 108 ns ns p<0.0001 p=0.05 p=0.0016 p=0.006 Csp12+/+ 107 106 CFU/ml CFU/ml Csp12+/+ 106 105 105 104 Csp12-/- Csp12-/- 103 104 0 1 2 3 4 5 0 1 2 3 5 4 Days Days Days Figure 1
i ii iii 50 40 30 20 10 iv v vi vii 0 1200 1000 800 600 400 200 Csp12-/- 0 Csp12+/+ 180 160 140 120 100 80 Csp12+/+ n=10 60 Csp12-/- n=10 40 20 Csp12-/- with anti-mINFg Receptor n=10 0 100 80 60 p=0.0294 Percent Survivng 40 20 0 0 20 40 60 80 Hours A B ( + 5mM ATP) IL-1 b Csp12-/- IL-1b p=0.06 Csp12+/+ ng/ml IL-18 p=0.09 p=0.03 pg/ml C INF p=0.05 Pro-IL-1 90 80 70 pg/ml 60 Relative Expression 50 40 30 20 LPS CpG PolyI:C MDP10 10 MDP100 PAMcsk4 Untreated Resiquimod PAM/MDP100 MDP100+CHX 0 - PAMcsk4/ Resiquimod PolyI:C LPS CpG PAM/MDP100+CHX D Figure 2
A IL-1 5 30 4 25 3 ng/ml 2 20 1 ng/ml 0 15 Poly I:C LPS 10 5 0 ( + 5mM ATP) B GM-CSF 30 25 20 - - PAMcsk4/ Resiquimod PAMcsk4/ Resiquimod PolyI:C PolyI:C LPS LPS CpG CpG pg/ml 15 10 5 Undifferentiated PMA 0 PMA Csp-12 PMA Csp-12 C299-A Figure 3
A B Control Caspase-12 WEHD Cleavage assay KDa 150 140 100 Control 75 Csp-12 120 50 Csp-12 C299A 100 37 25 80 20 p17 15 AFU/min 10 60 Western: Anti-IL-1 40 20 Western: Anti-tubulin 0 Vector Caspase-1 -20 C IP: Csp-1, 5, 9 Western: Anti-Csp-12 Beads Csp-1 Csp-5 Csp-9 KDa 150 100 75 Caspase-12 IP 50 37 Auto-processing products 25 IgG light chain 20 15 Total Csp-12 Control Casp-1, 5, 9 Figure 4
Nature 2005-04-04381B-Z Supplementary Materials: Figures for Enhanced Bacterial Clearance and Sepsis Resistance in Caspase-12 Deficient Mice Maya Saleh1, 2, John C. Mathison3, Melissa K. Wolinski1,Steve J. Bensinger1, Patrick Fitzgerald1, Nathalie Droin1, Richard J. Ulevitch3, Douglas R. Green1, ¶ and Donald W. Nicholson4, ¶. (see main text file for legends)
LPS - 1 10 - 1 10 g/ml Csp12-/- Csp12+/+ LPS - 1 10 - 1 10 g/ml Csp12-/- Csp12+/+ A ATG 1 5 6 7 8 9 10 2 3 4 - 3723 mCASP-12 gene a b c d e f g h i 3’ UTR 1 Kb Targeting construct Neo LacZ 1 6 8 9 10 2 3 4 5 7 Targeted allele Neo LacZ B C WT, Parent 2 ES line 2495 WT, Parent 1 MW marker Western:-mouse Caspase-12 50 KDa Endogenous * Targeted ITT (rC12) KO1 KO2 KO3 WT3 WT1 WT2 Csp12+/+ Csp12-/- D E Western: -Caspase-11 PBS 45 KDa Caspase-11 LPS 500 400 * 300 Fold 200 100 F 0 Csp12-/- Csp12+/+ Western: -Caspase-1 45 KDa Supp. Figure S1
LPS CpG PolyI:C MDP10 MDP100 PAMcsk4 Untreated MDP100+CHX Resiquinol PAM/MDP100 PAM/MDP100+CHX IL-6 40 35 30 25 ng/ml 20 15 10 5 0 TNF 140 120 100 pg/ml 80 60 40 20 0 Supp. Figure S2
_ LPS CpG PolyI:C PAMcsk4 Resiquinol A 1600 1400 1200 1000 B-Luc/-Gal 800 600 400 200 0 TNF vector rCsp-12 hCsp-12L TNF + rCsp-12 TNF + hCsp-12L B Csp-12+/+ 2500 Csp-12-/- 2000 1500 B-Luc/-Gal 1000 500 0 Supp. Figure S3
106 105 CFU/ml 104 103 Recipient Csp12+/+ Csp12+/+ Csp12-/- Csp12-/- Csp12-/- Donor Csp12+/+ Csp12-/- Csp12+/+ Control Bone Marrow Chimera Supp. Figure S4
Csp-12+/+ Csp-12-/- A IFN 35 30 25 pg/ml 20 15 10 5 0 B IL-6 3000 2500 2000 pg/ml 1500 1000 500 0 - PAMcsk4 PAMcsk4/ MDP Supp. Figure S5
45 40 35 30 25 20 15 10 5 0 0 2 4 6 8 10 12 60 50 40 30 20 10 0 0 2 4 6 8 10 12 Thapsigargin Tunicamycin 100 80 60 % PI % PI 40 20 0 0 2 4 6 8 10 12 M g/ml Csp-12+/+ Csp-12-/- Brefeldin A A23187 40 35 30 25 % PI % PI 20 15 10 5 0 0 2 4 6 8 10 12 g/ml M Supp. Figure S6