Download
1 / 2
20 likes | 227 Vues
Food Nanotechnology Lab. A. B. C. Kyung Hee Univ. Food Science and Biotechnology. Capturing and concentration of Escherichia coli O157:H7 from food sample using PLGA-PEG immunomagnetic micro-particle. Young- Rok Kim ( 김영록 ) Professor/Principal Investigator Food Nanotechnology Lab

E N D
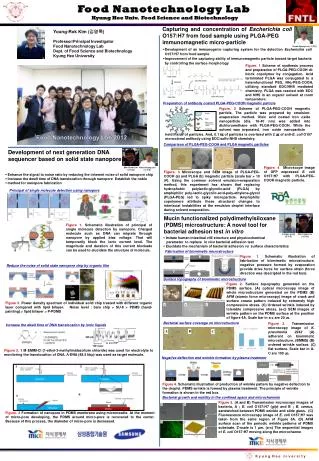
Food Nanotechnology Lab A B C Kyung Hee Univ. Food Science and Biotechnology Capturing and concentration of Escherichia coli O157:H7 from food sample using PLGA-PEG immunomagnetic micro-particle Young-Rok Kim (김영록) Professor/Principal Investigator Food Nanotechnology Lab Dept. of Food Science and BiotechnologyKyung HeeUniversity Kwan-HyungLee (이관형) • Development of an immunogenic capturing system for the detection Escherichia coli O157:H7 from food sample • Improvement of the capturing ability of immunomagnetic particle toward target bacteria by controlling the surface morphology At 500 mV Figure. 1 Scheme of systhesis process and preparation of PLGA-PEG-COOH di-block copolymer by conjugation. Acid terminated PLGA was conjugated to a heterofunctional PEG, NH₂-PEG-COOH, utilizing standard EDC/NHS mediated chemistry. PLGA was reacted with EDC and NHS in an organic solvent at room temperature. Preparation of antibody coated PLGA-PEG-COOH magnetic particle Figure. 2 Scheme of PLGA-PEG-COOH magnetic particle. The particle was prepared by emulsion-evaporation method. Oleic acid coated iron oxide nanoparticle (dia. 10-40 nm) was added into dichloromethane with PLGA-PEG-COOH. While the solvent was evporated, iron oxide nanoparticle held inside of particles. And, 0.1 ㎎ of particles is overlaied with 2 ㎍ of anti-E. coli O157 monoclonal antibody using EDC/sulfo-NHS chemistry. Food Nanotechnology Lab 2012 Comparison of PLGA-PEG-COOH and PLGA magnetic particles Development of next generation DNA sequencer based on solid state nanopore Figure. 4 Microscope image of GFP expressed E. coli O157:H7 with PLGA-PEG-COOH magnetic particle. Kwan-Hyung Lee (이관형) Min-Cheol Lim (임민철) Figure. 3 Microscope and SEM image of PLGA-PEG-COOH (a) and PLGA (b) magnetic particle (scale bar = 10 ㎛). Using the common solvent emulsion-evaporation method, this experiment has shown that replacing hydrophobic polylactic-glycolic-acid (PLGA) by amphiphilic poly-lactic-glycolic-acid-poly-ethylene-glycol (PLGA-PEG) led to spiky microparticle. Amphiphilic copolymers attribute these structural changes to interfacial instabilities at the emulsion droplet interface during solvent evaporation. ▪ Enhance the signal to noise ratio by reducing the inherent noise of solid nanopore chip ▪ Increase the dwell time of DNA translocation through nanopore Establish the noble ▪ method for nanopore fabrication Principal of single molecule detection using nanopore Mucin functionalized polydimethylsiloxane (PDMS) microstructure: A novel tool for bacterial adhesion test in vitro Figure 1. Schematic illustration of principal of single molecule detection by nanopore. Charged molecule such as DNA can migrate through nanopore by applied bias voltage. That will temporarily block the ionic current level. The magnitude and duration of this current blockade can be used to elucidate the structure of molecule. Ji-Hoon Jung (정지훈) Min-Cheol Lim (임민철) ▪ Imitate human intestinal villi structure and physicochemical parameter to replace in vivo bacterial adhesion test ▪ Elucidate the mechanism of bacterial adhesion vs surface characteristics Fabrication of biomimetic microstructure Figure 1. Schematic illustration of fabrication of biomimetic microstructure. negative pressure formed by evaporation provide drive force for surface strain (force direction was descripted in the red box). Reduce the noise of solid state nanopore chip by organic film Surface topography of biomimetic microstructure Figure 2. Surface topography generated on the PDMS surface. (A) optical microscopy image of whole microstructure generated on the PDMS (B) AFM (atomic force microscopy) image of crack and surface crease pattern induced by extremely high compressive stress. (C) Ordered wrinkle induced by tolerable compressive stress. (a-c) SEM images of wrinkle pattern on the PDMS surface at the position of figure 4A. Scale bar in a-c are 20 ㎛. Figure 2. Power density spectrum of individual solid chip treated with different organic layer compared with lipid bilayer. Noise level : bare chip > SU-8 > PDMS (hand-painting) > lipid bilayer > P-PDMS Bacterial surface coverage on microstructure Figure 3. Transmission microscopy image of K. pneumonia 2242 (A) adherent on biomimetic microstructure. (BMMS) (B) ordered wrinkle surface. (C) flat surface.Scale bar in A-C are 100 ㎛. Increase the dwell time of DNA translocation by ionic liquids Figure 3. 1 M EMIM-Cl (1-ethyl-3-methylimidazolium chloride) was used for electrolyte to monitoring the translocation of DNA. Λ-DNA (48.5 kbp) was used as target molecule. Negative deflection and wrinkle formation by plasma treatment Figure 4. Schematic illustration of production of wrinkle pattern by negative deflection to the droplet. PDMS wrinkle is formed by plasma treatment. The principle of wrinkle formation is shown in the red box. Bacterial growth and motility in the confined space and microchannels Figure 5.(A and B) Transmission microscopy images of bacteria, A ; E. coli O157:H7 (gfp) and B ; B. cereus, sandwiched between PDMS wrinkle and slide glass. (C) Fluorescence microscopy image of E. coli O157:H7 was taken from the same region of Figure 5A. (D) AFM surface scan of the periodic wrinkle patterns of PDMS substrate. Z-scale is 1 μm. (a-c) The sequential images of E. coli O157:H7 moving along the microchanne Figure. 4 Formation of nanopore in PDMS membrane using microneedle. At the moment of micro-pore developing, the PDMS around micro-pore is recovered to the center. Because of this process, the diameter of micro-pore is decreased. K y u n g H e e n i v e r s i t y
Food Nanotechnology Lab Invasion of Klebseillaspp. in human epithelial cell Klebsiellasppexpress GFP Kyung Hee Univ. Food Science and Biotechnology Electroporation Inactivation of virulence related wabG gene from 2,3-Butandiol producing Klebsiellapneumoniae and Klebsiellaoxytoca The role of lipopolysaccaride and capsular polysaccharide of Klebsiella spp. on adhesion and invasion to human epithelial cell Results GFP expression Duyen (유인) Jun-Ho Jang (장준호) ▪ Elimination of LPS that is major virulence factor of Klebsiella spp. by mutation of wabGgene which plays a key role in synthesis of outer core LPS . ▪ Observing characteristic of wabG mutant strains. ▪ Confirming glucose consumption (G.C) and 2,3-BDO production of wabGmutant strains. ▪ We present the role of LPS of Klebsiella species when they invade human epithelial cell. By using plasmid-harboring gene for GFP, we can monitor the presence or invasion ofKlebsiella species in vivo as well as their intensity instead of colony counting on agar plate. This method will give a quick and accurate means of monitoring the invasion process of pathogenic bacteria. In this study we evaluated the role of outer core LPS in invasion to human epithelial cells. Strategy for the disruption of wabG gene of Klebsiella strains. • Figure 2. Deletion of chloramphenicol gene in mutant Klebsiella strains. Mutant Klebsiella strains was transformed with 707-FLPe plasmid expressing FLP. After FLP expression, one part of mutant Klebsiella colony was incubated in no chloramphenicol LB Media and the other part was incubated in chloramphenicol LB media. Mutant Klebsiella strains that don’t grow in chloramphenicol LB media was chosen and confirmed deletion of chloramphenicol • gene by genomic DNA PCR. • Figure 1. wabG gene knock out process. Klebsiella strains was transformed with pRedET. After expression of Red α, Red β Red γ, Klebsiella strains and WFCFW cassette were transformed. Klebsiella strains that grown in chloramphenicol plate was chosen and confirmed wabG mutation by genomic DNA PCR. Characteristic of wabG mutant strains • Figure 3. FE-SEM analysis of the surface morphology of K. pneumoniae 2242 (A), K. pneumoniae2242ᐃwabG(B), K. oxytoca 1686 (C), K. oxytoca1686ᐃwabG(D), K. oxytoca 43863 (E), and K. oxytoca43863ᐃwabG(F). The surfaces of wild type Klebsiella species were shown to be covered with a thick layer of capsular polysaccharide. On the other hand, wabG mutant strains were absent of such layer and thus showed distinctive cell to cell • boundaries. Scale bar is 1 μm. Figure 1. 1 and 2: K. peumoniaeKCTC 2242 pET28a-gfp was incubated at 300C for 30 h; 3 and 4: K. oxytoca ATCC 43863 pET28a-gfp was incubated at 300C for 20 h and 30 h; 5 and 6: K. oxytoca KCTC 1686 pUC18-gfp was incubated at 300C for 30 h (1,3 and 5: wabG mutant type; 2, 4 and 6: wild type) Figure 2. 1, 2: K. pneumoniaeKCTC 2242; 3, 4: K. oxytocaKCTC 1686; 5, 6: K. oxytocaATCC 43863(1,3 and 5: wabG mutant type; 2, 4 and 6: wild type). • Figure 4. Visualization of the capsules expression in K. pneumoniae 2242 (A), K. pneumoniae2242ᐃwabG(B), K. oxytoca 1686 (C), K. oxytoca1686ᐃwabG(D), K. oxytoca 43863 (E), and K. oxytoca43863ᐃwabG(F). The capsules were shown in white layer around bacterial surface. Development of Theranostic Agent using PHA Synthase ▪Make fusion protein for drug delivery using PHA synthase ▪ Confirmation of function of fusion protein → A33scFv: binding ability, GFP: fluorescence ability, PHA synthase: particle synthesis ▪ Verification of drug loading capability using model molecules. ▪ Evaluating drug release profile and the efficacy of the delivery system Hee Su Kwon(권희수) Mucin FuctionalizedImpedimetric Biosensor for Monitoring Bacterial Adhesion ▪Development of an impedimetric sensing system to measure the binding characteristics of KlebsiellapeumoniaeKCTC 2242 to models surface ▪Examine the role of outer core of LPS and capsule on the adhesion of Klebsiella peumoniaeKCTC 2242 to an epithelial cell-like surface Ah-Young Kim (김아영) Equipment (A) • Figure. 1 (A) Eqiuvalent circuit; Rs = solution resistance, Ret = electron transfer resistance, Cdl= double layer capacitance • Ret 1 , Cdl1:between gold surface and mucin layer • Ret 2 , Cdl2: between mucin layer and solution • We measured impedance between mucin layer and solution. (B) Equipment for electrochemical detection using fluidic chamber ; Fluidic camber consists of platinum electrode, jig-body, inlet & outlet and screw type holder. Samples were injected at a constant rate by syringe pump. The data was obtained from an electrochemical analyzer VersaSTAT3 (Princeton Applied Research, Tennessee, USA). Analysis of electrochemical signal using computer software; V3-Studio (Princeton Applied Research). (B) Figure 1.A modified PHA synthase forms micelles with its PHA polymer chain (A). FE-SEM image of drug loaded PHA particles In vitro targeting of A33scFv fused PHB particles and competition assay Wild type K. pneumoniae KCTC 2242 on mucin surface Figure 2. A) Optical and fluorescence images of HT29 (A33negative) (a and b) and SW1222 (A33positive) (c and d) colon cancer cells after treatment with A33scFv-GFP fused PHB particles. Cells were treated with PHA nanoparticles produced by A33scFv-GFP fused PHA synthase. Scale bar is 30 µm. B)Competition assay results of A33scFv and A33scFv-GFP fused PHA synthase. The fluorescence intensity was decreased as A33scFv concentration increased. Verification of drug loading capability using model molecule Figure 3. A.Hydrophilic drug loading capability. A hydrophilic dye, Fluorescein sodium salt(FSS) was employed to study hydrophilic drug loading capacity. B. Lipophillic drug loading capability. A lipophilic dye, nile red was employed to study lipophilic drug loading capacity. Scale bar is 10 µm. Figure. 2 (A) Surface functionalization confirmed through impedimetric analysis of gold surface during surface functionalization.(a) Bare gold (b) 11-mercapto-1-undecanol (c) Epichlorohydrin (d) Mucin (e) Bacteria. Impedance value wasincreased by processing with surface modification. (B) Bode plots of K. pneumoniae KCTC 2242 in mucin functionalized gold surface. (C) Normalized impedance change(NIC) at 0.1 Hz. NIC(%) levels were increased concentration dependant manner. (R2= 0.99) K y u n g H e e U n i v e r s i t y