Session 2 Technology Developments in Hazard Mapping and Modeling
Session 2 Technology Developments in Hazard Mapping and Modeling. Ute J. Dymon, Professor Nancy L. Winter, PhD Kent State University. DEFINITIONS.

Session 2 Technology Developments in Hazard Mapping and Modeling
E N D
Presentation Transcript
Session 2Technology Developments in Hazard Mapping and Modeling Ute J. Dymon, Professor Nancy L. Winter, PhD Kent State University
DEFINITIONS • Technology – in emergency management is defined as tools that aid in processing information and in decision making to decrease negative results of a disaster. • Infrastructure technology - includes the systems that facilitate the implementation of technology such as networks, communications, the internet and remote sensing. Session: Technology Development in Hazard Mapping and Modeling
(Alexander, David. 1991. Advanced Information Networks for Management and Decision Making in Real-Time for Natural and Technological Disasters. From a speech given May 9, 1991 at a Conference on Safety and Technological Innovations, Turin, Italy.) LIST OF INFORMATION TECHNOLOGY RESOURCES Session: Technology Development in Hazard Mapping and Modeling
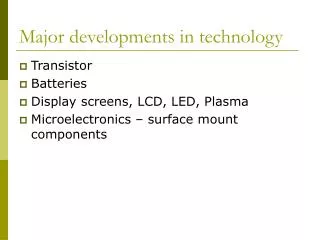
COMPUTER TECHNOLOGY TIMELINEBefore PCs Became Commonplace(Selections from - http://www.maxmon.com/timeline.htm) • 1943-1946 First general purpose electronic computer - ENIVAC • 1948-1951 First commercial computer – UNIVAC • Circa 1950 Maurice Karnaugh invents Karnaugh Maps (See http://www.maxmon.com/byteinfo.htm) • 1958 First integrated circuit (transistors before that • 1971 First microprocessor – The 4004 • 1974 Intel introduces the first true general-purpose microprocessor • 1975 Microsoft founded by Bill Gates and Paul Allen • 1979 Visicalc Spreadsheet • 1981 First IBM PC • PCs WITH GIS DID NOT BECOME COMMONPLACE UNTIL THE 1990’s • BEFORE THE 1990s, WHAT CHARACTERIZED THE COMPUTERS GENERALLY APPLIED IN EMERGENCY MANAGEMENT? • (They were gigantic mainframes used mostly at the federal level for modeling.) Session: Technology Development in Hazard Mapping and Modeling
A GIS: The Leading Emergency Management Mapping and Modeling Tool • “Mapping workhorse of any emergency scene” • Each Environmental Protection Agency (EPA) region in the U.S. develops its own plan for implementation of GIS for emergency management. • Federal agencies have developed applications and data that are available to state and local governments to support all stages of disaster planning. • GIS technology also includes commercially available off-the-shelf (COTS) GIS mapping and modeling tools. (For information about these programs see websites listed at the end of this Session.) Session: Technology Development in Hazard Mapping and Modeling
GIS DEFINITIONS • MOST GENERAL DEFINITION: Viewing data about the earth from a geographic perspective. • MORE DETAILED DEFINITION: Since geography tells us what is on Earth and how humans use the planet, this enormous amount of data needs to be organized (systematized). • GIS helps us observe and analyze data about Earth from a geographic perspective which means connecting data to a given location and also dividing it into subject matter layers that can be used to show relationships. Session: Technology Development in Hazard Mapping and Modeling
TECHNICAL DEFINITION FOR A GIS • The Environmental Systems Research Institute (ESRI) of Redlands, California, states, “A GIS manages, analyzes and displays geographic knowledge which is represented using one of the following series of information sets: • maps and globes • geographic data sets • processing and work flow models • data models • metadata.” • (http://www.gis.com/whatisgis/overview.html). Session: Technology Development in Hazard Mapping and Modeling
TWO MAJOR EMERGENCY MANAGEMENT FUNCTIONS OF GIS • Mapping • Relational Analysis Session: Technology Development in Hazard Mapping and Modeling
DEFINITION FOR RELATIONAL ANALYSIS • Relational analysis, originally termed map overlay, literally means the super-imposition of one map upon another to determine the features of a given site. • Map overlay, one of the first real uses of GIS, defines the relationships between layers of spatial data. • Today, in the use of relational databases, relational analysis shows the relationship between attributes (a numeric, text or image data field in a relational database that describes a spatial feature such as a point, line, node, area, or cell.) • SQL (Structured Query Language) is designed for relational databases. Session: Technology Development in Hazard Mapping and Modeling
SQL – STRUCTURED QUERY LANGUAGE • SQL (Structured Query Language) is a data query language designed for relational databases. • Commercial GIS programs such as Oracle, Informix, DB2, Access and Microsoft SQL Server have adopted the language to access data in a database that uses SQL. • The query method of SQL uses a graphic such as a circle, a box, or a polygon to select map features. It processes these map features based on their spatial relationships to other features. • Example: • During a chemical accident, the contaminated zone is identified then circles are drawn to select areas that show individuals who require special assistance during an evacuation mainly because they are not able to walk. • The location of persons with special needs for evacuation are thus identified in order for them to receive assistance. Session: Technology Development in Hazard Mapping and Modeling
DEFINITION FOR DIRECT SENSING • Environmental data gathered through direct contact with the physical environment. • The two major real-time emergency management support systems based on direct sensing are: • the USGS river gauging system that monitors streamflow • the National Weather Service weather station reporting system Session: Technology Development in Hazard Mapping and Modeling
EMWIN: the Emergency Managers Weather Information Network • EMWIN supplies emergency managers with NWS warnings, watches, forecasts, and other products at no recurring cost and disseminates a basic data stream. • EMWIN provides a live stream of weather information through three methods: radio, internet and satellite. Session: Technology Development in Hazard Mapping and Modeling
DEFINITION FOR REMOTE SENSING • Remote sensing means recording imagery or data and information from a distance. • Examples: • Photography • Satellite sensors tuned to various bands of the electromagnetic spectrum. Session: Technology Development in Hazard Mapping and Modeling
IMPORTANCE OF REMOTE SENSING BY SATELLITE • Satellite remote sensing is the largest single source of digital spatial data for mapping. Session: Technology Development in Hazard Mapping and Modeling
MAJOR SATELLITES • TIROS I – first U.S. weather satellite • GOES – Geostationary Operational Environmental Satellite • POES – Polar Orbiting Environmental Satellite • LANDSAT (also called Thematic Mapper) – has produced millions of images • SPOT – French • SATELLITE IMAGRY FROM RADARSAT SATELLITES – Canadian Session: Technology Development in Hazard Mapping and Modeling
LOWER ALTITUDE PLATFORMS • Airplanes • Balloons Session: Technology Development in Hazard Mapping and Modeling
Classification of Sensorhttp://www.profc.udec.cl/~gabriel/tutoriales/rsnote/cp2/2-1-1.gif Session: Technology Development in Hazard Mapping and Modeling
LIDAR TECHNOLOGY DIAGRAM http://www.woolpert.com/asp/articles/New_LIDAR_Technology.asp Session: Technology Development in Hazard Mapping and Modeling
LIDAR IS A COMBINATION OF LASERS AND GPS • Laser beams are sent to the earth’s surface in a sweeping pattern. Data points bounce back to the airplane. • GPS satellites outside the plane and a GPS receiver inside the plane record the location of each point of returning data. Session: Technology Development in Hazard Mapping and Modeling
NATIONAL FLOOD INSURANCE PROGRAM • Congress passed the National Flood Insurance Program in 1968 to help reduce the economic and social costs of flood losses. • The program is a joint venture between local communities and the federal government. • Flood insurance is sold in communities that agree to manage their floodplains so that no additional flood-prone structures are built on them. • A National Flood Insurance Program Coordinator assists both local governments and lenders, realtors and insurance agents through education, technical assistance and oversight to meet the requirements of the program. Session: Technology Development in Hazard Mapping and Modeling
Process Used to Produce FIRMs • FEMA conducts flood insurance studies (FISs) based on hydrologic and hydraulic investigations of flood risks. • This risk data distinguishes floodplain areas. • Based on this risk data, FEMA produces flood insurance rate maps (FIRMs) that reveal the spatial extent of special flood hazard areas (SFHAs) and other conditions as part of a flood risk assessment. • Insurance requirements and floodplain management of the NFIP are based on these SFHAs Session: Technology Development in Hazard Mapping and Modeling
RESULTS OF NFIP MAPPING • All U.S. communities with flood risks have had FIRMS published. • Approximately 20,400 communities nationwide have had flood risk assessments requiring the publication of over 80,000 individual FIRM panels at a cost of over $900 million. • Each year, FEMA distributes 6 to 8 million FIRMS to users and updates several thousand. • Over 2.5 million flood insurance policies have been written covering property worth over $200 billion nationwide. • (FEMA. 1999. Pine, John C. Technology and Emergency Management. Instructor Guide, Emergency Management Institute, Louisiana State University.) Session: Technology Development in Hazard Mapping and Modeling
STORM SURGE MODEL • A storm surge is an out-of-the-ordinary local rise in sea level from a tropical cyclone or other intense storm. • Its height is calculated by subtracting the elevation of the normal or astronomical tide from that of the observed storm tide. Session: Technology Development in Hazard Mapping and Modeling
Storm Surge Diagram http://www.floridadisaster.org/bpr/Response/Plans/Nathaz/hurricanes/ Session: Technology Development in Hazard Mapping and Modeling
EXAMPLES OF SURGE HEIGHTS OF POWERFUL HURRICANES • 25 feet - Hurricane Camille in Mississippi • 20 feet – Hurricane Hugo in 1989 in South Carolina • 16 feet - Hurricane Andrew in 1992 in Florida Session: Technology Development in Hazard Mapping and Modeling
(Alexander, David. 1991. Advanced Information Networks for Management and Decision Making in Real-Time for Natural and Technological Disasters. From a speech given May 9, 1991 at a Conference on Safety and Technological Innovations, Turin, Italy.) DECISION SUPPORT SYSTEM FOR HAZARD MITIGATION Session: Technology Development in Hazard Mapping and Modeling
MAP SERVER Session: Technology Development in Hazard Mapping and Modeling
Mobile GIS/GPS Session: Technology Development in Hazard Mapping and Modeling