Download
1 / 38
380 likes | 502 Vues
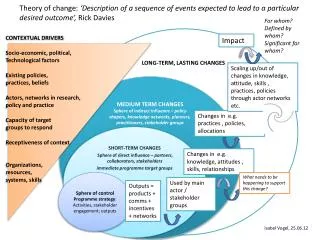
The Impact of SST and Vegetation Changes on Long-Term Drought. Fourth International CLIVAR Climate of the 20 th Century Workshop Hadley Centre for Climate Prediction and Research 13-15 March 2007. Siegfried Schubert, Max Suarez, Philip Pegion, Randal Koster and Julio Bacmeister

E N D
The Impact of SST and Vegetation Changes on Long-Term Drought Fourth International CLIVAR Climate of the 20th Century Workshop Hadley Centre for Climate Prediction and Research 13-15 March 2007 Siegfried Schubert, Max Suarez, Philip Pegion, Randal Koster and Julio Bacmeister Global Modeling and Assimilation Office Goddard Space Flight Center
Questions Addressed What are the relative roles of the Pacific and Atlantic in forcing long term drought over the United States? What is the impact of “Global Warming”? What is the impact of vegetation changes? Approach Assess impact in AGCM simulations forced with idealized SST patterns of variability, and with historical changes in vegetation
AGCM: NSIPP-1 (NASA S-I Prediction Project) Climatology and Skill (Bacmeister et al. 2000, Pegion et al. 2000, Schubert et al. 2002) Great Plains drought (Schubert et al. 2003; 2004) Global grid point dynamical core, 4rth Order (Suarez and Takacs 1995) Relaxed Arakawa-Schubert Convection (Moorthi and Suarez 1992) Shortwave/Longwave Radiation (Chou et al. 1994, 1999) Mosaic interactive land model (Koster and Suarez 1992, 1996) 1st Order PBL Turbulence Closure (Louis et al. 1982) Model resolution: 3 degree latitude by 3.75 degree longitude (34 levels) C20C AGCM runs with Specified SST HadISST and sea ice dataset (1902-2004) 22 ensemble members - same SST, different ICs AGCM runs forced with leading SST EOFs AGCM runs forced with historical changes in vegetation type (cropland and pasture)
Annual Mean Great Plains Precipitation Correlated with SST (1901-2004) Observations Model - individual ens. members Model - correlation with ensemble Mean
Leading EOFs and Time series (annual mean SST - 1901-2004) Global Warming Pattern Pacific Pattern Atlantic Pattern
Begin by looking at Impacts of Pacific and Atlantic Patterns
SST EOFs and Correlations with Precipitation (Ensemble mean 1901-2004)
Idealized Experiments NATL PacInd SST Forcing patterns (warm phase)
Annual Mean Precipitation Responses Major drought conditions WN -CN WW CW WC CC NW -NC Responses to individual EOFs Responses to combined EOFs Pluvial conditions
v’2 850 and Z200 V 850 and Precip Seasonality in the Response to Pacific SST DJF Shift in storm tracks MAM JJA SST forcing Changein LLJ SON
slp and Z200 V 850 and Precip Seasonality in the Response to Atlantic SST SST forcing
Impact of Soil Moisture Feedbacks on JJA Precipitation CW CW Interactive soil moisture No soil moisture feedbacks WC WC
Impact of Global Warming/Cooling Pattern Positive Phase Annual Mean Surface Temperature Negative Phase °C
Histograms of Daily Surface Temperature Southern Great Plains Northern Great Plains Negatively skewed Negatively skewed extremes extremes Red: +GW SST, Blue: -GW SST, Black: climatological SST
Composite Fields for Extreme Warm Days Southern Great Plains Northern Great Plains
Response to Globally Uniform SST Anomaly: 0.32K Response to Global Warming Anomaly Pattern From Hailan Wang
C20C Project - Dataset Basic data set: •annual crop and pasture fraction on a 0.5 degree global grid for 1700 to 1992 (Nathalie de-Noblet) •http://dods.extra.cea.fr/data/p25nath/DIVA/ForcingData/ Modified vegetation types: •cropland and pasture for the 'observed data sets' replace the agriculture vegetation type from the Sib dataset, other vegetation types are adjusted accordingly •the 'observed' data were re-scaled to have the same mean as the Sib data
Summary and Conclusions • Both the Pacific and Atlantic Patterns impact precip in the Great Plains • Cold (warm) Pacific leads to drought (pluvial conditions) • Warm (cold ) Atlantic leads to drought (pluvial conditions) • Largest impacts occur when Pacific and Atlantic have opposite signed SST anomalies • The influence of the Atlantic pattern is largest during the summer and fall • impact is on the flow of moisture entering from the Gulf of Mexico • The Pacific pattern impacts Great Plains precipitation during all seasons • during winter and spring the influence appears to be primarily through changes in the planetary waves and associated changes in storm tracks • during summer and fall the impact appears to be also through an impact on the low level moisture entering the US from the Gulf • The Global Warming pattern shows some regional impact over land • E.g. substantial warming over North America • Similar warming impacts are found with uniform SST warming • Little impact on precipitation • Just beginning to look at vegetation impacts (cropland and pasture) • Appear to be some intriguing regional temperature impacts (e.g. North America)