Testing for Subadditivity of Vertically Integrated Electric Utilities
280 likes | 430 Vues
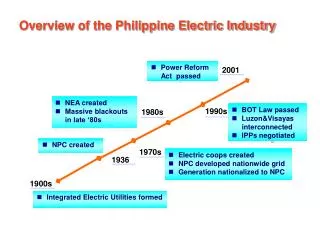
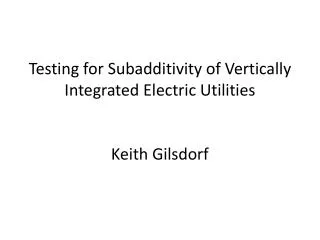
Testing for Subadditivity of Vertically Integrated Electric Utilities. Keith Gilsdorf. Kamil. Focus1: estimating the degree of scale economies in generation. Focus2: effect of vertical integration may have on cost structure.

Testing for Subadditivity of Vertically Integrated Electric Utilities
E N D
Presentation Transcript
Testing for Subadditivity of Vertically Integrated Electric Utilities Keith Gilsdorf Kamil
Focus1: estimating the degree of scale economies in generation. Focus2: effect of vertical integration may have on cost structure. Importance: most researchers consider transmission and distribution stages to be natural monopolies. What impact does vertical integration have on cost structure? Do integration economies make the cost function subadditive?
Subadditivity – electric firms are multistage natural monopolies So… deregulated generation markets would not exhibit effective competition. The paper investigates subbadditivity utilizing the multiproduct cost framework . Effect of vertical integration on cost structure is captured by the multistage cost function. It provides conditions for the multistage natural monopoly.
What impact does capacity utilization have on production cost? ( If deregulation proposals expand generation market areas, utilities may be better able to increase customer diversity and operate at a higher load factor. That reduces reliance on the peak load capacity.) What effect does the utility's sales output mix have on production costs? Thus, will greater specialization in retail sales rather than sales for resale result in higher or lower production costs?
METHODOLOGY G – generation T – trasmission and distribution
We cannot have cost information at all output levels, so E&H suggest a local test for subadditivity. A cost function is subadditive IFF it is subadditive over the observed output levels. Converse is not necessarily true.
If Sub<0, then cost function is subadditive If Sub=0, -||- additive If Sub>0, -||- superadditive
φ and w iteration φ=0.1, w=0.1 φ=0.1, w=0.2 φ=0.1, w=0.3 …………………… φ=0.1, w=1 φ and w iteration φ=0.2, w=0.1 φ=0.2, w=0.2 φ=0.2, w=0.3 …………………… φ=0.2, w=1 φ and w iteration φ=0.3, w=0.1 φ=0.3, w=0.2 φ=0.3, w=0.3 …………………… φ=0.3, w=1
VARIABLES • Two outputs, three input prices, and three hedonic variables. • The utility provides two outputs: generation and transmission-distribution services. Generation and transmission-distribution output levels are measured by megawatthours (MWH) produced by fossil fuel steam plants • The three input prices are wages, fuel, and capital services. • The implicit rental price is a Divisia price index derived from capital service prices for generation, transmission, distribution, and general plant based on the following formula
The Handy-Whitman Index of Public Utility Construction Costs and the Producer Price Index for capital equipment measure the acquisition cost of generation, transmission, distribution, and general plant, respectively. To derive the weighted average cost of capital, a discounted cash flow model is used to estimate the cost of equity while yields based on published ratings measure the cost of debt and preferred stock. In addition, each capital cost component is weighted according to its share of the firm's capitalization. Depreciation rates (da) follow the 1.5 declining balance method, incorporating the estimated useful lives of electric plant provided by Christensen, Gollop, and Stevenson
The hedonic variables are customer density (DN), capacity utilization (CU), and the percentage of total sales to ultimate consumers (PULT). Customer density refers to the number of ultimate consumers (residential, commercial, and industrial) per square mile of service territory.
COST FUNCTION Baumol, Panzar, and Willig (B-P-W) identify several desirable properties a multiproduct cost function should possess, including properness, flexibility, and tractability. A proper cost function is non-negative, linearly homogeneous, concave, and monotonic with respect to input prices and has positive marginal costs. Flexibility implies that the cost function imposes no restrictions on the first and second partial derivatives and is consistent with subadditivity and superadditivity.
The author adopts the translog multiproduct cost function (TMCF) and assume cost minimization and competitive input markets. The TMCF meets the flexibility and tractability criteria
EMPIRICAL RESULTS Table II presents the estimated coefficients of the TMCF. Monotonicity conditions were violated at one observation and input price concavity conditions were violated at twenty observations, but both conditions were satisfied at the point of approximation (i.e., the sample means). TRANSLOG MULTIPRODUCT COST FUNCTION
EMPIRICALRESULTS Sixteen companies exhibit negative estimates for Max Sub while thirty-seven estimates are positive, although none are statistically significant. Thus, the additivity hypothesis over the admissible region can not be rejected, which violates conditions consistent with local and, therefore, global subadditivity. The results do not support the hypothesis that integrated electric utilities are multistage natural monopolies
It should be noted, however, that failure to reject the additivity hypothesis does not necessarily imply a lack of vertical integration economies. Economies of scope between stages is a necessary, but not a sufficient condition for subadditivity. It does imply that integration economies do not make the multistage cost function subadditive.
Capacity Utilization and Sales-Output Mix Table V presents firm-specific estimates of these equations along with their standard errors. In all but sixteen cases, increased utilization reduces production costs. Ten of these estimates are statistically significant at either a .05 or .10 level of significance. These findings suggest that regulatory policies: will reduce electric costs for various utilities. increase utilization rates. For example, pro-competition policies which expand the firm's generation markets may allow for greater customer diversification and higher annual load factors. In addition, the results also provide support for rate design policies which promote higher load factor rates
IV. Conclusions The study's findings provide no evidence of subadditivity for vertically integrated electric utilities over the admissible region, implying that integrated utilities are not multistage natural monopolies. Although this result is consistent with pro-competition policies, it does not necessarily support complete industry divestiture since economies of scope between stages may exist in the absence of subadditivity.
Furthermore, the analysis offers support for regulatory policies which encourage higher annual utilization rates, including ensuring non-discriminatory access to transmission service. The cost-reducing effect of higher load factor rates represents another potential benefit of expanded wholesale markets arising from deregulatory policies.