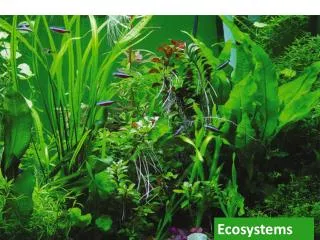
Ecosystems
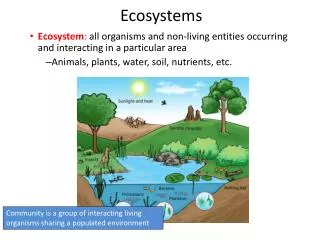
Ecosystems. And Energy Flow. Ecology. The study of how organisms interact with one another and with their nonliving environment. Organization of Life. Cells --> --> Organisms --> populations --> communities --> ecosystems --> biosphere P. 66 Fig. 4-2. living part of Earth

Ecosystems
E N D
Presentation Transcript
Ecosystems And Energy Flow
Ecology • The study of how organisms interact with one another and with their nonliving environment
Organization of Life • Cells --> --> Organisms --> populations --> communities --> ecosystems --> biosphere • P. 66 Fig. 4-2
living part of Earth • = community + environment • biotic & abiotic factors • Cycling of nutrients • pop. of different species • type of species • # of species • relationships b/n species • - members of same species Biosphere Biosphere Ecosystems Communities • Species = similar organisms, produce offspring Populations Organisms
Spheres of Earth • Troposphere~ 0-11 miles above earth • Contains the majority of Earth’s air, contains bad ozone O3 • Stratosphere~ 11-30 miles above earth • The ozone layer, good ozone O3 (sunscreen) • Lithosphere~ Crust and Mantle • Important for nonrenewable resources • Soil nutrients for plants • Ecosphere~aka Biosphere; 12 miles beneath sea level to the highest mountain • Life is only found in this layer • Hydrosphere~ Water, ice, & water vapor
p. 68 Fig. 4-6 Atmosphere Biosphere Vegetation and animals Soil Crust Rock core Lithosphere Mantle Crust (soil and rock) Crust Biosphere (Living and dead organisms) Atmosphere (air) Hydrosphere (water) Lithosphere (crust, top of upper mantle)
Life on Earth depends on: Energy flow Element cycling Gravity p. 69 Fig. 4-7 Biosphere Carbon cycle Phosphorus cycle Nitrogen cycle Water cycle Oxygen cycle Heat in the environment Heat Heat Heat
PHOTOSYNTHESIS light + 6CO2 + 12H20 --> C6H12O6 + 6O2 + 6H20 RESPIRATION C6H12O6 + 6O2 --> 6CO2 + 6H2O + energy
Components of Ecosystems • Abiotic (nonliving) - water, air, nutrients, solar energy • Biotic (living) - plants, animals, microorganisms
Adjacent Ecosystems Ecotone Notice the lack of sharp Boundaries Great Diversity Land zone Transition zone Aquatic zone Number of species Species in land zone Species in aquatic zone Species in transition zone only
Sun Producers (rooted plants) Producers (phytoplankton) Primary consumers (zooplankton) Secondary consumer (fish) Dissolved chemicals Tertiary consumer (turtle) Sediment Decomposers (bacteria and fungi)
Sun Oxygen (O2) Producer Carbon dioxide (rabbit) Secondary consumer (fox) Primary consumer (rabbit) Producers Falling leaves and twigs Precipitation Soil decomposers Water Soluble mineral nutrients
Abiotic Factors • NONLIVING physical and chemical factors which affect the ability of organisms to survive and reproduce • Different species thrive under different conditions • Temperature, weather, water availability • Sunlight • pH
p. 73 Fig. 4-13 Abiotic Factors Terrestrial Ecosystems Aquatic Life Zones • Sunlight • Temperature • Precipitation • Wind • Latitude (distance from equator) • Altitude (distance above sea level) • Fire frequency • Soil • Light penetration • Water currents • Dissolved nutrient concentrations (especially N and P) • Suspended solids
Biotic Factors • LIVING components of ecosystem • Producers (autotrophs) • Primary consumers (heterotrophs) • Secondary & tertiary consumers • Carnivores, Herbivores, Omnivores • Decomposers (recyclers) - Detritus Feeders
Detritus feeders Decomposers Carpenter ant galleries Termite and carpenter ant work Bark beetle engraving Long-horned beetle holes Dry rot fungus Wood reduced to powder Mushroom Powder broken down by decomposers into plant nutrients in soil Time progression Fig. 4.15, p. 75 BIOTIC ROLES in environment
Heat Heat Heat Heat Heat Abiotic chemicals (carbon dioxide, oxygen, nitrogen, minerals) Solar energy Decomposers (bacteria, fungus) Producers (plants) HEAT = low quality energy Consumers (herbivores, carnivores)
Food Webs and Energy Flow • Food chain • Linear sequence depicting the flow of energy between organisms • Trophic levels = feeding levels • Producers --> primary consumers --> secondary consumers --> tertiary consumers • Food web • Interconnected, complex food chain • Arrows drawn in direction of energy flow FROM PREY --> TO PREDATOR
FOOD CHAIN - linear flow of energy p. 77 Fig. 4-18 First Trophic Level Second Trophic Level Third Trophic Level Fourth Trophic Level Producers (plants) Primary consumers (herbivores) Secondary consumers (carnivores) Tertiary consumers (top carnivores) Heat Heat Heat Heat Solar energy Heat Heat Heat Detritivores (NUTRIENT RECYCLERS) (decomposers and detritus feeders)
Humans • FOOD WEB • p. 78 Fig. 4-19 • locate producers • locate consumers • trophic levels • - top consumers Blue whale Sperm whale Killer whale Elephant seal Crabeater seal Leopard seal Emperor penguin Adélie penguins Petrel Squid Fish Carnivorous plankton Herbivorous zooplankton Krill Phytoplankton
Pyramid of Energy Flow • Loss in energy b/n successive trophic levels • 10% gets transferred • Explains… • Why there are few top carnivores (eagles, hawks, tigers, white sharks) • Why such species are first to suffer when the ecosystems that support them are disrupted • Why these species are so vulnerable to extinction
Heat Heat Heat Heat Heat Tertiary consumers (human) Decomposers 10 Secondary consumers (perch) 100 Primary consumers (zooplankton) 1,000 10,000 Usable energy Available at Each tropic level (in kilocalories) Producers (phytoplankton)
Energy Input: 1,700,000 kilocalories Incoming solar energy not harnessed 1,679,190 (98.8%) Energy Transfers 20,810 (1.2%) Producers Waste, remains Metabolic heat, export 4,245 3,368 13,197 Herbivores 720 383 2,265 Carnivores 90 21 272 Top carnivores 5 16 Decomposers, detritivores Energy Output Total Annual Energy Flow 20,810 + 1,679,190 1,700,000 (100%) 5,060 Top carnivores Decomposers/detritivores 21 Carnivores 383 Herbivores 3,368 Producers 20,810
Graphs of biomass of organisms in the various trophic levels for two ecosystems. The size of each square represents dry weight per square meter of all organisms at that trophic level. Tertiary consumers Secondary consumers Primary consumers Producers Abandoned Field Ocean
Tertiary consumers Secondary consumers Primary consumers Producers Generalized graphs of numbers of organisms in the various trophic levels for two ecosystems. Grassland (summer) Temperate Forest (summer) Fig. 4.23, p. 86
Primary Productivity • An ecosystem’s gross primary productivity (GPP) = Rate at which an ecosystem’s producers convert solar energy into chemical energy as biomass • Net primary productivity (NPP) = {Rate at which producers store chemical energy as biomass <photosynthesis>} - {Rate at which producers use chemical energy stored as biomass <aerobic respiration>}
Variation in productivity on Earth High productivity -- green Low productivity -- yellow Fig. 4.24, p. 87
Estuaries Swamps and marshes Tropical rain forest Temperate forest Northern coniferous forest (taiga) Savanna Agricultural land Woodland and shrubland Temperate grassland Lakes and streams Continental shelf Open ocean Tundra (arctic and alpine) Desert scrub Extreme desert 800 1,600 2,400 3,200 4,000 4,800 5,600 6,400 7,200 8,000 8,800 9,600 Average net primary productivity (kcal/m2/yr) Estimated annual average of NPP per unit area in major life zones and ecosystems Fig. 4.25, p. 88
63% Not used by Humans Human use of the biomass produced by photosynthesis 3% Used Directly 16% Altered by Human Activity 8% Lost or Degrades Land Fig. 4.26
Ecologists • Field research • GIS (geographic information systems) • Lab research • Systems analysis
Define objectives Systems Measurement Identify and inventory variables Obtain baseline data on variables Make statistical analysis of relationships among variables Data Analysis Determine significant interactions System Modeling Construct mathematical model describing interactions among variables System Simulation Run the model on a computer, with values entered for different variables System Optimization Evaluate best ways to achieve objectives Systems Analysis Fig. 4.35, p. 98
Solar Capital Ecosystem services Air resources and purification Climate control Recycling vital chemicals Water resources and purification Renewable energy resources Soil formation and renewal Natural Capital Nonrenewable energy resources Waste removal and detoxification Nonrenewable mineral resources Natural pest and disease control Potentially renewable matter resources Biodiversity and gene pool Fig. 4.36, p. 99