Fault Tree Analysis
Fault Tree Analysis. Part 8 - Probability Calculation. RESULTS OF PROBABILITY CALCULATIONS. 1) The probability of the top event. 2) The “importance” of the cut sets and primal events. PROBABILITY OF EVENTS CONNECTED BY AN “AND” GATE.

Fault Tree Analysis
E N D
Presentation Transcript
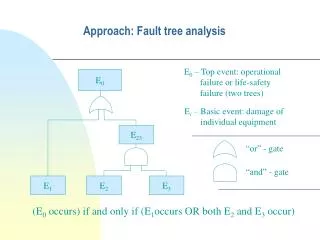
Fault Tree Analysis Part 8 - Probability Calculation
RESULTS OF PROBABILITY CALCULATIONS 1) The probability of the top event. 2) The “importance” of the cut sets and primal events.
PROBABILITY OF EVENTS CONNECTED BY AN “AND” GATE In general, if events X and Y are probabilistically dependent, then Where, is the probability that X occurs given that Y occurs. If events X and Y are probabilistically independent, then and Usually, it is assumed that the basic events in a fault tree are independent. Thus,
PROBABILITY OF EVENTS CONNECTED BY A m-OUT-OF-n VOTING GATE Assume then where
SHORT-CUT CALCULATION METHODS Information Required Approximation of Event Unavailability When time is long compared with MTTR and , the following approximation can be made, Where, is the MTTR of component j.
Z AND X Y IF X and Y are Independent
Z OR X Y
COMPUTATION OF ACROSS LOGIC GATES AND GATES OR GATES
COMPUTING TOP EVENT PROBABILITY 1.Compute q (= ) for each primal Event. 2.Compute the Probability or Failure Rate for each Cut Set (QK). Use the “AND” Equation. 3.Compute the Top Event Probability or failure rate. Use the “OR” Equation.
3 TEMPERATURE SENSOR 2 HEAT EXCHANGER 8 1 HOT NITRIC ACID TO REACTOR 5 4 AIR TO OPEN TRC SET POINT 6 7 COOLING WATER
+1 +1 -1 +1 +1 +1 0 (HX FOULED) +1 +1 +1 0 VALVE STUCK -1 +1 -1 (CONTROL VALVE REVERSED) +1 0 (TEMP. SENSOR STUCK) +1 +1 +1 -1 (TRC REVERSED) -10 0 (TRC STUCK) 0 (ON MANUAL) -1 +1 +1
CUT SET IMPORTANCE The importance of a cut set K is defined as Where, is the probability of the top event. may be interpreted as the conditional probability that the cut set occurs given that the top event has occurred. PRIMAL EVENT IMPORTANCE The importance of a primal event is defined as or Where, the sum is taken over all cut sets which contain primal event .
[ Example ] TOP OR G2 G3 G6 OR AND OR G4 G7 1 2 3 OR 6 AND G5 AND 5 G2 3 3 4 GATE CUT SETS 2 5 4 7 3 6 1 (1) (2) (3 , 4) (3 , 4) (5) (1 , 3) (2 , 3) (3 , 4 , 3) (3 , 5) (6) (1 , 3) (2 , 3) (1) (2) (3 , 4) (3 , 5) (6) (1 , 3) (2 , 3) Hence, the minimal cut sets for this tree are : (1) , (2) , (6) , (3 , 4) and (3 , 5).
As an example , consider the tree used in the section on cut sets. The cut sets for this tree are (1) , (2) , (6) , (3,4) ,(3,5). The following data are given from which we compute the unavailabilities for each event. 1 .16 1.5E-5 (.125) 2.4E-6 2 .2 1.5E-5 (.125) 3.0E-6 3 1.4 7E-4 (6) 9.8E-4 4 30 1.1E-4 (1) 3.3E-3 5 5 1.1E-4 (1) 5.5E-4 6 .5 5.5E-5 (.5) 2.75E-5 Now, compute the probability of occurrence for each cut set and top event probability. (1) 2.4E-6 (2) 3.0E-6 (6) 2.75E-5 (3,4) 3.23E-6 (3,5) 5.39E-7 3.67E-5
THE COMMON–MODE FAILURES WITHIN FAULT TREES PUMP 2 (STAND – BY) POWER 2 2 3 Shared Power Source S SWITCH POWER 1 1 PUMP 1 (RUNNING)
10 0 +1 PUMP 2 SPEED +1 PUMP 2 MECH. FAILURE 0 +10 0 +1 POWER 2 FAILURE 0 0 -10 S +1 0 -10 POWER 1. FAILURE (PUMP 1 SPEED = -10) SWITCH STUCK +1 0 -1 -10 0 POWER 1 FAILURE 0 1 PUMP 1 SPEED PUMP 1 MECH. FAILURE 0 1 -10
G1 AND Pump 1 Shut Down Pump 2 Not Started OR OR G2 G3 P1 Mech Fail. Local Power 1 Failure Local Power 1 Failure P2 Mech Fail. Local Power 2 Faiture Switch Stuck 1 2 3 4 5 2
GATE MIN CUT SETS G2 G3 G1 (1) , (2) (2) , (3) , (4) , (5) (1 , 2) , (1 , 3) , (1 ,4) , (1 ,5) (2 , 2) , (2 , 3) , (2 ,4) , (2 , 5) (1 , 2) , (1 , 3) , (1 , 4) , (1 , 5) (2) , (2 , 3) , (2 , 4) , (2 , 5)
OR 2 AND AND AND 1 5 1 3 1 4 COMP q 1 2 3 4 5 1/3 1/25 1/5 1/35 1/10 4 Hr. 5 Hr. 1 Week 1 Week 3 Months
Cut Set (2) (1 , 3) (1 , 4) (1 , 5) 1 / 25 Yr. 1 / 762 Yr. 1 / 5333 Yr. 1 / 120 Yr. TOP Event Unavailability Importances