Visualization and Analysis of Co-Expressed Gene Clusters in Alternative Respiratory Pathway Induction
Explore associations of co-expressed gene clusters, induce biological pathways in amino acid metabolism, and discover novel insights through cluster analysis using ModuleFinder. Investigate the regulation of substrate transport, ETC flux, and ROS production. Discover the impact of inductions on amino acid metabolic pathways and mitochondrial function.

Visualization and Analysis of Co-Expressed Gene Clusters in Alternative Respiratory Pathway Induction
E N D
Presentation Transcript
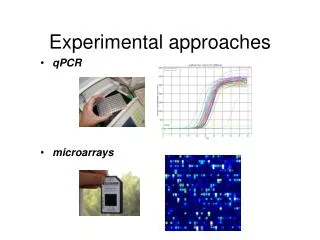
Experimental approaches • qPCR • microarrays
RESULTS: CLUSTER ANALYSIS • Co-expressed gene clusters • Associations not previously reported • Functionally related genes co-induced: • evidence for induction of specific biological pathways
| Entry of substrates into mt Limit availability of substrates for ETC? …limit flux through ETC …limit ROS production/oxidative damage v SUBSTRATE TRANSPORT WAS REPRESSED
Amino acid metabolism AMINO ACID METABOLIC PATHWAYS WERE INDUCED
BCKDC IVD MCCAse HIBDH BRANCHED CHAIN AMINO ACID PATHWAYS INDUCED Branched chain amino acids BCAT * Branched chain amino acid metabolism Branched chain a-keto acids BCKDC Acyl-CoA IVD * MCCAse Enoyl-CoA * E-CoAH 3-methyl-gluteconyl-CoA * E-CoAH Hydroxy-acyl-CoA Val Leu * Ile HIBDH Acetoacetate + Acetyl-CoA Propionyl-CoA Propionyl-CoA + Acetyl-CoA Image adapted from: Taylor et. al. (2004) Plant Physiol 134(2): 838-48.
PROBLEMS WITH CLUSTERING • Good at identifying genes that are co-expressed in response to all/most treatments • Not good at identifying genes that are co-expressed in response to specific subsets of treatments
Treatments Genes PROBLEMS WITH CLUSTERING Treatments Genes
NEW ALGORITHM: ModuleFinder • Choose an initial subset of treatments • Identify subset of genes that are co-expressed in response to these treatments • Cluster into groups
NEW ALGORITHM: ModuleFinder • Look for other treatments under which these gene clusters are co-expressed
NDB2 AOX1a carriers Classical ETC components All associated with: flux through ETC ATP synthase activity ROS RESULTS: ModuleFinder Amino acid synthesis
Research focus - mitochondria protein import replication, transcription & translation biosynthetic pathways amino acids nucleotides vitamins folate lipids heme TCA cycle membrane transport respiratory chain
TIM17 TIM22 TIM23 TIM44 TOM7 TOM9 TIM16 TIM14 TOM20 TOM40 MPP Transcript profiling: import components
Transcript profiling: mRNA stability Cytc(a) t ½ = 11 h Average transcript abundance (relative to pre-treatment) TIM22-3 t ½ = 54 min
Transcript profiling: mRNA stability Transcript abundance Time (hours)
Degradation of Transcripts • Inhibit Transcription • Measure [T] at different times • Rate of degradation