Marine Ecology
Marine Ecology. Summer 2013 2 nd Session. Course Information. Instructor: Dr. Lesley Baggett Office : House 4 Office Hours: Tuesdays 11:30 to 12:30, or by appointment Phone: 861-8525 (House 4); 251-458-5679 (cell) Email: lbaggett@disl.org. Course Information.

Marine Ecology
E N D
Presentation Transcript
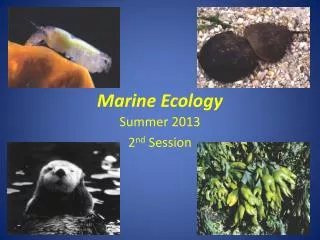
Marine Ecology Summer 2013 2nd Session
Course Information Instructor: Dr. Lesley Baggett Office:House 4 Office Hours: Tuesdays 11:30 to 12:30, or by appointment Phone: 861-8525 (House 4); 251-458-5679 (cell) Email:lbaggett@disl.org
Course Information • Participation in lab and field experiments and field trips is required • Grading will be on Plus/Minus System • Grading: • Exams (Mid-Term and Final) 70% • Lab Notebook 25% • Lab Participation 5%
So Why Study Marine Ecology? • Currently, approximately 39% of the world’s population lives near coast • Avg. Density = 80 ind./km2 (but in countries such as Bangladesh and Egypt more like 1000 ind./km2 )
So Why Study Marine Ecology? • World’s oceans provide: • Food, medicines • Renewable energy (tidal and wind) • Non-renewable energy (oil and gas) • Transportation routes (goods and people) • Mined commodities (e.g. minerals and diamonds) • Repositories for waste products • Recreation
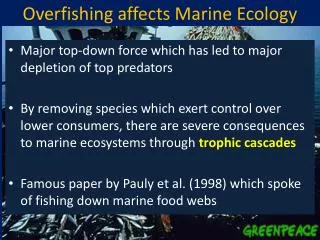
Threats to Marine Systems • Overfishing • Sea level rise • Pollution (nutrient, toxins, thermal) • Erosion • Development • Invasive species
Modern Research Methods www.blackbeard-cruises.com NASA
Hypothesis Testing • Hypothesis = a statement that can be tested • Ho = Null hypothesis. States that there is no effect/relationship • Ha = Alternative hypothesis. States that there is an effect/relationship • Examples: • Ho= There is no difference in the growth of organisms in nutrient-poor and nutrient-rich environments. • Ha= Organisms growing in nutrient-rich environments will experience greater growth than those in nutrient-poor environments.
The Scientific Method for Ecologists • Patterns in nature are all around us. • Processes are factors that contribute to the observed patterns. • Based on natural history, intuition and prior study, hypotheses are proposed and tested regarding the processes that produced the patterns until (ideally) only one hypothesis remains.
Types of Evidence • Non-Experimental Research • Data dredging • Meta-analysis • Experimental Research • Mensurative experiments • Manipulative experiments • Pulse experiments • Press experiments
Sampling a Population • Biological population = the sum of all organisms of a single species that inhabit a particular area • Very rare to be able to sample the entire population (i.e. 100% of the individuals) • Instead, must sample a subset of the population to infer how a variable affects a certain aspect of a population • Statistical population = the entire set of measurements collected from a habitat, a community, a biological population, or a part of the biological population
Sampling a Population • Physical sample – a portion, or subset, of material objects (ex. 1 liter of seawater, all vegetation located within a quadrat, a sample of 100 fish from the biological population) • Statistical sample – the actually-measured portion of the statistical population. Is a portion of the larger dataset (the statistical population) • The data obtained from measurements of the physical sample (e.g., the temperature or P content of the water, the biomass of the vegetation, the fork lengths of the fish)
Sampling a Population • Often focus on one species or a subset of species found within an area • Know exactly what your device/methods are sampling (e.g. organisms living on the substrate, within the substrate, in the water column, etc.) • No single sampling device can adequately sample an entire habitat, community, or biological population • A sample seldom contains all life stages of a organism • Must always clearly define the ecological entity of interest and select an appropriate sampling technique
Selecting Samples • Attempt to collect a representative sample of the defined population, community, or habitat • Usually obtain random samples to ensure that legitimate conclusions can be drawn about the population (with a known chance of error) • Implies that each entity of interest has an equal opportunity of being collected in a sample • Collections made in one sample do not influence collections made in another sample
Selecting Samples • Biased sampling occurs when some members of the population are more likely to be sampled than others, or if the recording of some measurements affects the recording of other measurements • Can haphazardly select locations of sample collection (ex. Close your eyes and throw a quadrat into a seagrass bed) • Can randomly select study sites or locations of sample collection within a site using random number generator or a random numbers table
Random Sampling Randomly Generated Numbers: 12, 6, 28, 46, 1, 31, 34, 10, 43, 25
Sample Replication • Can’t draw conclusions based on single sample • Repeated measurements can vary greatly from one another, so a single value has a high probability of being far removed from the mean • Must perform a series of replicated samples (replicates) from which the mean of the statistical population of interest can be estimated as well as the error involved • Number of replicates/sample size: No really set number. • Often depends on logistics of sampling and funding • Can use power analyses and other procedures to determine if you had enough replication
Variability in Sample Values Standard Deviation = an approximation of the average difference (deviation) of the values from the mean (low value = values are close to the mean; high value = values are spread over a large range) The smaller the value, the better the sample mean is as a population estimate Unaffected by sample size Standard Error = a measure of the standard deviation of sample means from the true population mean (how close to the population mean your sample mean is likely to be) Used to calculate confidence intervals for your mean (see Appendix I in lab manual) Should decrease with larger sample sizes, as your estimate of the population mean improves Sample values: 5 1 10 6 15 4 9 Mean = 7.14 Std. Dev. = 4.6
Controls • Allow investigator to get an idea of the normal conditions without manipulation • Must compare results of manipulative treatments to controls
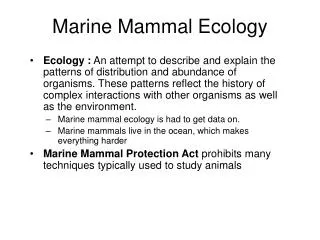
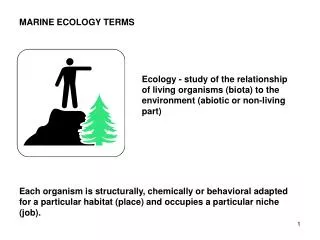
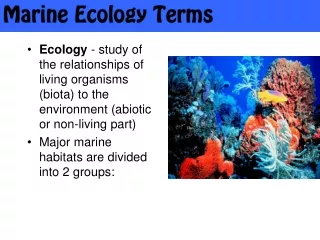
Marine Biology and Ecology • Functional biology = how an organism carries out basic functions, such as reproduction, and aspects of metabolism • Ecology = the interaction of organisms with their environments and how these interactions determine the abundance and distribution of the organisms • Biodiversity = the number of species in an area, and what controls that number
Marine Biology and Ecology • Functional biology = how an organism carries out basic functions, such as reproduction, and aspects of metabolism • Ecology = the interaction of organisms with their environments and how these interactions determine the abundance and distribution of the organisms • Biodiversity = the number of species in an area, and what controls that number
Marine Biology and Ecology • Functional biology = how an organism carries out basic functions, such as reproduction, and aspects of metabolism • Ecology = the interaction of organisms with their environments and how these interactions determine the abundance and distribution of the organisms • Biodiversity = the number of species in an area, and what controls that number
Terrestrial vs. Marine Environments – Physical and Chemical Differences • Seawater is much more dense than air (as such, organisms can float in it readily • Seawater strongly absorbs light • Effects of gravity – sea creatures do not have to invest as much in skeletons/bodily support b/c they gain buoyancy from water • O2 can be limiting in the marine environment
Terrestrial vs. Marine Environments – Biological Differences