Download
1 / 47
470 likes | 591 Vues
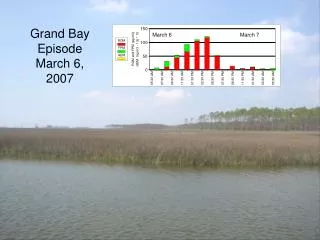
Grand Bay Episode March 6, 2007. March 6. March 7. March 6. March 7. March 6. March 7. March 6. March 7. March 6. March 7. March 6. March 7. March 6. March 7. March 6. March 7. March 6. March 7. March 6. March 7. March 6. March 7. March 6. March 7. March 6. March 7.

E N D
Grand Bay Episode March 6, 2007 March 6 March 7
March 6 March 7
March 6 March 7
March 6 March 7
March 6 March 7
March 6 March 7
March 6 March 7
March 6 March 7
March 6 March 7
March 6 March 7
March 6 March 7
March 6 March 7
March 6 March 7
March 6 March 7
March 6 March 7
additional information regarding this episode
Back trajectories simulated with the NOAA HYSPLIT model using meteorological on a 12 km grid • Trajectories started from the Grand Bay site (marked with a star on the map) at 5 different heights representing different positions in the mixed layer (0.1, 0.3, 0.5, 0.7, 0.9) • Note that the times are represented in UTC (Universal Time Coordinate) which is 6 hours later than Central Standard Time, e.g., 20 UTC = 14:00 Central Standard Time • Large mercury emissions sources are indicated on the map, including: • Wtsn = Watson coal-fired power plant • FChm = First Chemical hazardous waste incin / Chevron refinery • PsIn = Pascagoula municipal waste incinerator • Brry = Barry coal fired power plants • Danl = Daniel coal fired power plant • Hlnm = Holnam cement plant • Intl = International Paper • ScIt = Scott Paper and International Paper
Additional trajectories immediately before period shown in slides above
Grand Bay “Episode” March 14, 2007 (very low concentrations)
Grand Bay Episode Nov 18, 2006
additional information regarding this episode
Back trajectories simulated with the NOAA HYSPLIT model using meteorological on a 12 km grid • Trajectories started from the Grand Bay site (marked with a star on the map) at 5 different heights representing different positions in the mixed layer (0.1, 0.3, 0.5, 0.7, 0.9) • Note that the times are represented in UTC (Universal Time Coordinate) which is 6 hours later than Central Standard Time, e.g., 20 UTC = 14:00 Central Standard Time • Large mercury emissions sources are indicated on the map, including: • Wtsn = Watson coal-fired power plant • FChm = First Chemical hazardous waste incin / Chevron refinery • PsIn = Pascagoula municipal waste incinerator • Brry = Barry coal fired power plants • Danl = Daniel coal fired power plant • Hlnm = Holnam cement plant • Intl = International Paper • ScIt = Scott Paper and International Paper
Additional trajectories immediately before period shown in slides above
Additional trajectories immediately after period shown in slides above
Grand Bay Episode March 7, 2007