Download
1 / 20
210 likes | 392 Vues
Life satisfaction in elderly women. Vibeke Horstmann , fil lic. Health and economy are related to life satisfaction. Are health and economy equally important in groups that are living under different life conditions?

E N D
Life satisfaction in elderly women Vibeke Horstmann, fil lic
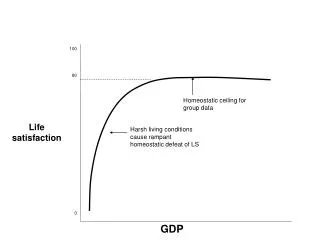
Health and economy are related to life satisfaction • Are health and economy equally important in groups that are living under different life conditions? • Is the way of handling problems in life important for life satisfaction? • Are the relations to life satisfaction stable over time?
Elderly single living women • The women are participating in the ENABLE-AGE Survey Study starting 2002 • Latvia: 260 women • Sweden: 288 women
Life satisfaction All in all – how satisfied are you with your life?
Morten Almkvist Sweden Latvia Morten Almkvist Barrybar http://www.flickr.com/photos/barrybar/2482410 Historical differences: Turbulence in Latvia - Political stability in Sweden 21 May 2013 Home and Health Workshop / Vibeke Horstmann
Differences between the countries: • Infant mortality • Latvia : 9 per 1000 new-borns • Sweden : 3 per 1000 new-borns • Life expectancy at birth • Latvia : 72 years • Sweden : 81 years • GDP • Latvia : GDP per capita: 4,000 US dollar • Sweden : GDP per capita: 27,000 US dollar
Differences between the groups of women: • Age • Latvia: 75-84 years • Sweden: 80-89 years • University education • Latvia : 26 % • Sweden : 6 % • Standard of living • Latvia : 20 % do not have bath and toilet within the dwelling • Sweden : Income per month 8 times higher
Health and economy are not equally important: 15 % 6 % Health Health Life satisfaction Life satisfaction Economical standard Latvia 18 % 2 % Sweden Economical standard
Coping attitudes: • Endurance:”I never give up” • Same in the Latvian and Swedish samples • Helplessness: ”I ask others for help” • Much stronger in Latvian than Swedish sample • Distraction:”I try to think of something else” • Much stronger in Latvian than Swedish sample
Ways to achieve higher life satisfaction: Coping attitudes are important for life satisfaction: • Latvia : 29 % • Sweden : 15 % • Problems with health: • Latvia: the woman manages to distract herself • Sweden: the woman has high endurance • Problems with economy: • Not related to the way the woman deals with the problems, neither in Latvianor Sweden
If one only is healthy … ? Low standard of living and politically unstable conditions seems to be a more serious obstacle than poor health for achieving life satisfaction Co-authors: Signe Tomsone, Maria Haak, Susanne Iwarsson, Anne Gräsbeck. Life Satisfaction in Older Women in Latvia and Sweden – Relations to Standard of Living, Aspects of Health and Coping Behaviour Journal of Cross Cultural Gerontology
Nine years later… Remaining for studying life satisfaction: • Latvia: 49 women • Sweden: 51 Women
Are changes in health and economy related to change in life satisfaction? • Is there a change in life satisfaction? • Are there changes in health and economy? • Conclusions
Change in life satisfaction? Increased Decreased Lifesatisfaction2011
changes in Changes in factors related to life satisfaction 50 % had more symptoms 8 % perceived worse health 43 % perceived worse health 56 % decreased independence
Conclusions Despite the decrease in functional independence life satisfaction increased in the Latvian sample thanks to the increase in satisfaction with the income As there was an increase in especially number of symptoms there was a decrease in life satisfaction in the Swedish sample