Download
1 / 5
50 likes | 200 Vues
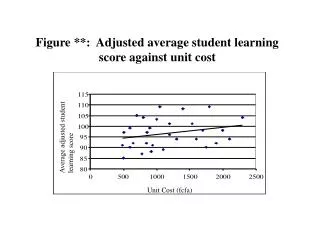
Figure **: Adjusted average student learning score against unit cost. Average adjusted student learning score. Unit Cost (fcfa). Figure**: Number of students and teachers in primary education in Sao-Tome y Principe Percentage of randomness : 3 %. Number of teachers 15

E N D
Figure **: Adjusted average student learning score against unit cost Average adjusted student learning score Unit Cost (fcfa)
Figure**: Number of students and teachers in primary education in Sao-Tome y Principe Percentage of randomness : 3 % Number of teachers 15 14 A AA 13 A A AA 12 A B A 11 A A A 10 9 A A A 8 A A AAB 7 A A A 6 A AA 5 A AA 4 AB CBAA A 3 A AAAB 2 AAB B 1 A BBA A 0 100 200 300 400 500 600 Number of students 16 A A | | | | | | |
Figure **: Number of Students and Teachers in Primary Education in Burkina Faso Percentage of randomness: 28% Number of teachers 16 A A A 14 A AAA B A A A 13 AA A AA A B B C A A A AA 12 A A A C A AA BA AA B AA B A A 11 A A A A AAB A A BABA ABB AAAAA C DB BA AAA A 10 A A AA B A AAAAA AA A AAAA B A AABAA AAC C BAA B AB C AB AA A 9 A A AAAA AA AB BAA AABBAFBCBBADBBBABD ADCBAD CBB C AAAA B B A 8 A A ACB AABAEDGAACBCDD DCDDCBACDDBFCEBBCDEBBBADBAABA CA AA A AAA 7 AACAA CDCDBCCDEAFFDB JGEIDCADEEGEGJEDCFEC DBC B CABCA BA BB A B BA A 5 AA AACCBHIGGGIEDGCBEBDGCEAECAACBAA A A BA A A 4 A B DCCEDIHQNNJIKFMKDDCGCBAAACC A AB 3 ACGZZZZZZZZZZZZZZZZWHGIHEAAAAACAA A 2 AIVZZZZZZZZZZNMNHCADBAA B B A 1 AKZZZZZZZOLEEECCA A A A A A B 0 100 200 300 400 500 600 700 800 Number of students 15 A A A 6 A BEDDFGLLNIKLNKQQJKNLMQGKGIKKKFEFFCHFFCED ABABAC BAAAA A A | | | | | | | |