Graphing Review
This graph reviews the relationship between air temperature (in degrees Celsius) and the number of chirps per minute produced by crickets. It showcases the effect of the independent variable (temperature) on the dependent variable (chirp count). Proper axis labeling with units (# of chirps/minute, air temperature in degrees Celsius) is essential. Scale reminders emphasize fitting data appropriately and ascending in equal increments to convey meaningful insights. Determine suitable ranges for both variables to construct an insightful graph.


Graphing Review
E N D
Presentation Transcript
X vs. Y Axis Y X
Independent vs. Dependent Variable Dependent Independent
Labeling Axis • Labels must include units # of Chirps (minute) Air Temperature (degrees C)
Title for Graphs • Must include both variables The Effect of Air Temperature on Number of Cricket Chirps # of Chirps (minute) Air Temperature (degrees C) The effect of independent variable on dependent variable
Scale Reminders • Scale needs to fit data • Scale should ascend in equal increments • Ex: Temperature ranges from 0 degrees Celsius to 30 degrees Celsius. What is a good range for your scale? • Ex: Number of chirps range from 2 to 1000. What is a good range for your scale?
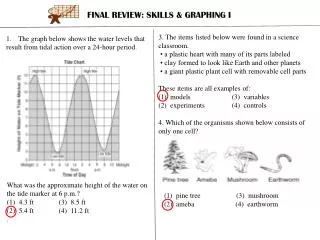
Create a title, what are the variables?, what are the units?