Prognosis
Prognosis. FMED 1531 Lecture 11 Spring 2007 Kim Cooper, Ph.D. Lecture Outline. What is a prognosis? How are prognoses determined? How is prognosis reported? What is a prognostic factor? Example: breast cancer How can we compare survival curves?. What is a prognosis?.

Prognosis
E N D
Presentation Transcript
Prognosis FMED 1531 Lecture 11 Spring 2007 Kim Cooper, Ph.D.
Lecture Outline • What is a prognosis? • How are prognoses determined? • How is prognosis reported? • What is a prognostic factor? • Example: breast cancer • How can we compare survival curves?
What is a prognosis? • Definition: prediction of the future course of a disease following its onset • How long will condition or symptom last? • How dangerous is condition? • How much discomfort can I expect? • Will it leave any permanent disability? • Avoid being vague when unnecessary • Avoid being certain when it’s misleading • Customize the prognosis to specific patient-prognostic factors
How are prognoses determined? • Cohort studies • Follow group with condition forward in time and record outcome • Stratify by factors • If factors predict significantly different outcome, call them prognostic factors • Can use to customize prognosis to specific subgroups • Compare clinical course to natural history of disease • Natural history: course of disease without treatment, acts as baseline • Clinical course: course of disease with treatment
How are prognoses determined? • Problems with prognosis studies • Zero time bias • Zero time is time at which patient enters study cohort • Where is zero time for a patient relative to disease course? • If all patients are not at the same point in disease process at zero time, then results of study will be meaningless (unless this is properly accounted for)
How is prognosis reported? • Several measures • Single numbers • Survival curves
Why do we need something more than a single number for prognosis? • Data on 5 year survival for 3 diseases • Dissecting aneurysm: • Approximately 10% • AIDS: • Approximately 10% • Chronic granulocytic leukemia: • Approximately 10% • So, what’s the problem? • Look at the detailed time course of survivorship • Survival curves (Kaplan-Meier analysis: don’t need to know details of how curves constructed)
Survival Curves 2 yr. Survival = 10% 2 yr. Survival = 40% 2 yr. Survival = 70% 2 yr. Survival = 40%
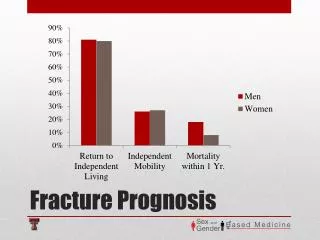
What is a prognostic factor? • Definition: a prognostic factor is some characteristic of a subgroup of a cohort that gives that subgroup a significantly different prognosis than the cohort as a whole • Find by stratifying the cohort by different factors and looking for changes in prognosis in the stratified subgroups • Common variables for stratification • Age • Gender • Disease severity
Cancer Prognosis • NCI data on 5-year survival % • Spread from original site as a prognostic factor
Breast Cancer Prognosis Estrogen Receptor Status as a Prognostic Factor
Example: breast cancer • Let’s look at a recent example of a prognosis study • “A Pooled Analysis of Bone Marrow Micrometastasis in Breast Cancer,” Braun et al, NEJM, August 25, 2003.
Example: breast cancer • Issue: • Distant metastasis implies a very poor prognosis from breast cancer • Need to detect as early as possible • Lymph-node involvement is not a very good predictor of distant metastasis • Recall that bone is the most common site of distant metastasis from a primary breast cancer
Example: breast cancer • Braun et al want to know if bone marrow micrometastases are a better predictor of outcome than the standard prognostic factors • Did meta-analysis of nine studies • Include 4703 patients in stages I-III of breast cancer • Did additional tracking of many patients to complete 10 years of follow-up
How can we compare survival curves? • How can we decide if survival curves are statistically significantly different? • Two approaches • Log Rank Test • Easier to do • Only works for two independent variables • Cox regression • More accurate • Works for comparing more than two independent variables
How can we compare survival curves? • The log rank test • Modification of 2 test • Combine all events (from treatment and control) into one set (ordered by time) • At each death compute probability it comes from treatment or control group based on relative number in each group • Null hypothesis: there is a constant death rate that is equal for both groups • Thus the total number of deaths from each group should be proportional to their relative size
Comparing Survival Curves • The log rank test • From the above, can compute the total expected number of deaths in each group • Calculate 2 based on the difference between the observed and the expected counts using the standard formula • Look up the experimental 2 value in the table and compare to the critical 2 • If the experimental 2 is greater than the critical 2, we should reject the null hypothesis
How can we compare survival curves? • Cox regression • Uses an exponential equation to fit the survival curves • Looks to see how likely it would be to get these two curves form a single population