Understanding Water Quality Index (WQI): Parameters and Historical Insights
The Water Quality Index (WQI) provides vital information on the health of U.S. waterways, revealing a significant improvement from the 1970s, where 65% of tested waters were unsafe, to about 33% today. While legislation like the Clean Water Act has curtailed point source pollution, nonpoint source pollution remains a challenge. Key parameters tested include Dissolved Oxygen, Fecal Coliform, pH, Biochemical Oxygen Demand, and more. Understanding these factors is crucial for safeguarding aquatic ecosystems and promoting environmental awareness among the public.

Understanding Water Quality Index (WQI): Parameters and Historical Insights
E N D
Presentation Transcript
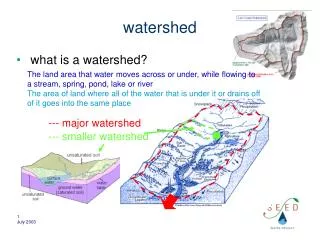
Watershed Watchdogs Understanding the Water Quality Index (WQI) Parameters
A Brief History of U.S. Water Quality • 1970’s – At least 65% of water tested in U.S. waterways was unsafe for fishing or swimming • 1972 – Clean Water Act passed by U.S. Congress • ~2000 – Only about 33% of the nation’s waters are considered unsafe WHY? Efforts to reduce “point source pollution” have met with success (legislation regulating industry) But, most of damaging pollution is “nonpoint source pollution” that comes from several places and reaches streams by way of RUNOFF – very difficult to control!
What is the point of testing water quality? If we can’t trace the specific source of pollution, how can we possibly stop it? • We know which substances are largely responsible for decreasing water quality, because we understand ecology. • By testing the chemistry of the water, we find out what pollutants are present and can propose possible sources. • Creating an environmentally aware public through EE will promote a more environmentally friendly way of life.
We test for nine parameters outlined by the National Sanitation Foundation The data is analyzed and the product is a score between 0 and 100 (worst to best) to compare stream health. Dissolved Oxygen (DO) Fecal Coliform pH Biochemical Oxygen Demand (BOD) Water Temperature Phosphates (Orthophosphates) Nitrates Turbidity Total Dissolved Solids Water Quality Index (WQI)
Dissolved Oxygen (DO) Fish need to breathe, just like humans do! • Oxygen comes from: • Churning at surface • Photosynthesis from aquatic plants • Oxygen is depleted by: • - High turbidity • - Increased temperature • Decreased SAVs • If there is not enough dissolved oxygen… Measured in: mg/L and % Saturation Acceptable limit: At least 5-6 mg/L
Fecal Coliform Would you want to swim in your toilet? …Neither do the fish! • E. Coli is a naturally occurring intestinal bacteria • - Not usually harmful • May indicate other harmful microorganisms • Sources: • Sewage contamination • Natural mammal population Measured in: # of bacterial colonies per 100mL of water Acceptable Limits: Drinking: 0, 0 Primary: <200, <1,000 Secondary: <1,000, <5000
Raw sewage enters a stream
pH A change in the aquatic atmosphere can STRESS out aquatic life! • pH affects chemical and biological processes • Cellular respiration • Stresses body systems of most organisms • Factors: • Acid rain - Heavy precip • Sewer overflow - Melting snow • Ag runoff - Dissolved • Accidental spills minerals Optimal Range: 6.5 – 8.2 Most Rainwater: 5.6 DC Rainwater: 4.2 – 4.4
Biochemical Oxygen Demand Tells us how much micro-organic matter is floating around in a stream Measures how much oxygen is used by bacteria that help to decompose dead organic matter Factors that affect BOD: - Algae, organic matter, blooms when nutrients are in excess - Raw sewage, adds organic matter to water • If BOD is high: • Too much O2 is consumed • Fish cannot survive • Acceptable limit: • 5 mg/L or less is ideal • > 30 mg/L is unsafe
Temperature Change Aquatic organisms can’t pull on a sweater like we can – they need consistent temperatures! • Affects chemical properties of water • - Affects biological and physical processes in the aquatic ecosystem • Examples: • Oxygen content • Photosynthesis rates • Metabolic rates • Sensetivity to toxics, parasites, diseases Acceptable limit: < 4-5 degrees Celsius change per mile of stream • Factors: • Bank vegetation removal • Impounding water • Discharge of heated water
Ohio Costa Rica
Phosphates (Orthophosphates) Orthophosphates are the limiting factor for plant growth! Aquatic plants and algae use phosphates for metabolic reactions and growth • Source: • Fertilizers • Detergents • Industrial wastes Acceptable Limits: 1 mg/L is ideal >4 mg/L causes eutrophication Extra Nutrients More Algae More Turbidity Less Photosynthesis More Algae + Bacteria that Decompose Organic Matter = Less Dissolved Oxygen!
Nitrates Nitrogen is an indicator nutrient! • Measured because: • Extremely high levels can indicate harmful pollution sources • Can make groundwater unsafe for humans Acceptable Limits: < 4.4 mg/L • Sources: • Animal waste, esp. duck and goose droppings • Decomposing organic matter • Air pollution, esp. commuters
Turbidity Imagine that “LA Smog” happens underwater Effects: Higher water temperatures Blocks photosynthesis Clogs gills of fish Acceptable Levels: Drinking water < 0.5 JTU Groundwater < 1 JTU Stream water < 40 JTU Major Factors: Soil particles from erosion Plankton and microbes from eutrophication
Total Dissolved Solids Exactly how much “stuff” is dissolved in this water? Sources: HUMAN ACTIVITY Runoff carrying street salts Lawn fertilizers Wastewater treatment outflow Acceptable Limits: Drinking water <500 mg/L Stream water 100-2000 mg/L (average is ~600 mg/L) Effects: Water balance problems for organisms (example: dissolved calcium) Low levels limit growth of aquatic life
References: • BTW Watershed Watchdogs Resource Booklet • MDE website: http://www.mde.state.md.us/Programs/MultimediaPrograms/environ_emergencies/FishKills_MD/index.asp • Earth Justice website: http://www.earthjustice.org/urgent/print.html?ID=17 • NY State Dept of Env’tal Conservation: http://www.dec.state.ny.us/website/dar/ood/acidrain.html • Australian Government (OzEstuaries): http://www.ozestuaries.org/oracle/ozestuaries/indicators/In_turbidity_f.html • Biology Corner:http://www.biologycorner.com/bio1/diffusion.html