Download
1 / 58
580 likes | 733 Vues
Financial Crisis and the Future of the P/C Insurance Industry Challenges Amid the Global Economic Storm. New York Society of Securities Analysts 13 th Annual Insurance Conference New York, NY February 9, 2009. Robert P. Hartwig, Ph.D., CPCU, President

E N D
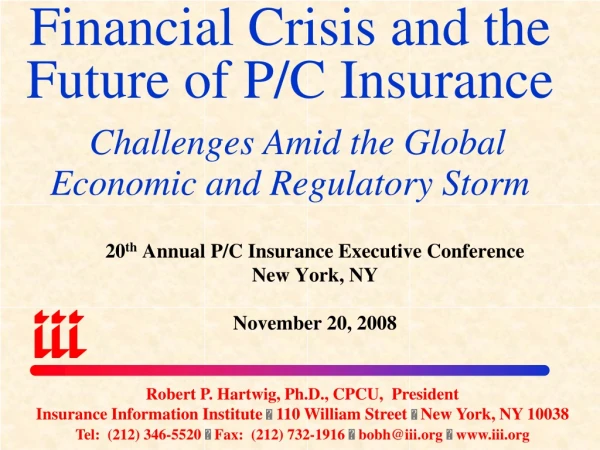
Financial Crisis and the Future of the P/C Insurance Industry Challenges Amid theGlobal Economic Storm New York Society of Securities Analysts 13th Annual Insurance Conference New York, NY February 9, 2009 Robert P. Hartwig, Ph.D., CPCU, President Insurance Information Institute 110 William Street New York, NY 10038 Tel: (212) 346-5520 bobh@iii.org www.iii.org
Presentation Outline • Financial Crisis & The Weakening Global Economy: Insurance Impacts • Banks vs. Insurers • Economic Growth & Recession • Financial Strength & Ratings • P/C Insurance Industry Overview & Outlook • Profitability • Premium Growth • Underwriting Performance • Financial Market Impacts • Capital & Capacity • Regulatory Response to Crisis • Emerging Blueprint of Regulatory Overhaul • Important Threats Facing P/C Insurers in 2009 • Q & A
THE ECONOMIC STORMWhat a Weakening Economy and Financial Crisis Mean for the Insurance IndustryExposure & Claim Cost Effects
Real GDP Growth* Recession began in December 2007. Economic toll of credit crunch, housing slump, labor market contraction is growing The Q4:2008 decline was the steepest since the Q1:1982 drop of 6.4% *Yellow bars are Estimates/Forecasts from Blue Chip Economic Indicators. Source: US Department of Commerce, Blue Economic Indicators 1/09; Insurance Information Institute.
Length of US Recessions,1929-Present* Months in Duration Current recession began in Dec. 2007 and is already the longest since 1981. If it extends beyond April, it will become the longest recession since the Great Depression. * As of February 2009 Sources: National Bureau of Economic Research; Insurance Information Institute.
Unemployment Rate:On the Rise January 2000 through December 2008 Dec. 2008 unemployment jumped to 7.2%, exceeding the 6.3% peak during the previous cycle Previous Peak: 6.3% in June 2003 Trough: 4.4% in March 2007 Unemployment will likely peak above 8% or 9% during this cycle, impacting payroll sensitive p/c and non-life exposures Average unemployment rate 2000-07 was 5.0% Dec-08 Source: US Bureau of Labor Statistics; Insurance Information Institute.
U.S. Unemployment Rate,(2007:Q1 to 2010:Q4F)* Rising unemployment will erode payrolls and workers comp’s exposure base. Unemployment is expected to peak above 8% in the second half of 2009. * Blue bars are actual; Yellow bars are forecasts Sources: US Bureau of Labor Statistics; Blue Chip Economic Indicators (1/09); Insurance Info. Inst.
Monthly Change Employment*(Thousands) Job losses in 2008 totaled 2.589 million, the highest since 1945 at WW II’s end; 11.1 million people are now defined as unemployed. The Nov./Dec. 2008 losses were the largest since May 1980 loss of 431,000, but less than the Dec. 1974 loss of 602,000 Source: US Bureau of Labor Statistics: http://www.bls.gov/ces/home.htm; Insurance Info. Institute
New Private Housing Starts,1990-2010F (Millions of Units) Exposure growth forecast for HO insurers is dim for 2009 with some improvement in 2010. Impacts also for comml. insurers with construction risk exposure New home starts plunged 34% from 2005-2007; Drop through 2009 trough is 65% (est.)—a net annual decline of 1.35 million units I.I.I. estimates that each incremental 100,000 decline in housing starts costs home insurers $87.5 million in new exposure (gross premium). The net exposure loss in 2009 vs. 2005 is estimated at about $1.2 billion. Source: US Department of Commerce; Blue Chip Economic Indicators (1/09); Insurance Information Inst.
Auto/Light Truck Sales,1999-2010F (Millions of Units) Weakening economy, credit crunch are hurting auto sales; Gas prices less of a factor now. New auto/light truck sales are expected to experience a net drop of 5.7 million units annually by 2009 compared with 2005, a decline of 20.7% Impacts of falling auto sales will have a less pronounced effect on auto insurance exposure growth than problems in the housing market will on home insurers Source: US Department of Commerce; Blue Chip Economic Indicators (1/09); Insurance Information Inst.
Wage & Salary Disbursements (Payroll Base) vs. Workers Comp Net Written Premiums Wage & Salary Disbursement (Private Employment) vs. WC NWP $ Billions $ Billions 12/07-? 7/90-3/91 3/01-11/01 Weakening wage and salary growth is expected to cause a deceleration in workers comp exposure growth Shaded areas indicate recessions *9-month data for 2008 Source: US Bureau of Economic Analysis; Federal Reserve Bank of St. Louis at http://research.stlouisfed.org/fred2/series/WASCUR; I.I.I. Fact Books
Total Industrial Production,(2007:Q1 to 2010:Q4F) Obama stimulus program is expected benefit impact industrial production and therefore insurance exposure both directly and indirectly Industrial production began to contract sharply during H2 2008 and is expected to shrink through the first half of 2009 Figures for H2:09 and 2010 revised sharply upwards to reflect expected impact of Obama stimulus program Sources: US Bureau of Labor Statistics; Blue Chip Economic Indicators (1/09); Insurance Info. Inst.
U.S. $825B Economic Stimulus Package, By Category $ Billions Commercial insurance lines that will benefit from the Obama stimulus plan include workers comp, commercial property, commercial auto, surety, inland marine and others Sources: House Appropriations Committee; Wall Street Journal, January 16, 2009
Real GDP Growth vs. Real P/C Premium Growth: Modest Association P/C insurance industry’s growth is influenced modestly by growth in the overall economy Sources: A.M. Best, US Bureau of Economic Analysis, Blue Chip Economic Indicators, 8/08; Insurance Information Inst.
FINANCIAL STRENGTH & RATINGSIndustry Has Weathered the Storms Well
P/C Insurer Impairment Frequency vs. Combined Ratio, 1969-2007 Impairment rates are highly correlated underwriting performance and could reached a record low in 2007 2007 impairment rate was a record low 0.12%, one-seventh the 0.8% average since 1969; Previous record was 0.24% in 1972 Source: A.M. Best; Insurance Information Institute
Summary of A.M. Best’s P/C Insurer Ratings Actions in 2008* P/C insurance is by design a resilient in business. The dual threat of financial disasters and catastrophic losses are anticipated in the industry’s risk management strategy. Despite financial market turmoil, high cat losses and a soft market in 2008, 81% of ratings actions by A.M. Best were affirmations; just 3.8% were downgrades and 4.0% upgrades *Through December 19. Source: A.M. Best.
Reasons for US P/C Insurer Impairments, 1969-2005 2003-2005 1969-2005 Deficient reserves, CAT losses are more important factors in recent years *Includes overstatement of assets. Source: A.M. Best: P/C Impairments Hit Near-Term Lows Despite Surging Hurricane Activity, Special Report,Nov. 2005;
Critical Differences Between P/C Insurers and BanksSuperior Risk Management Model & Low Leverage Makea Big Difference
How Insurance Industry Stability Has Benefitted Consumers • BOTTOM LINE: • Insurance Markets—Unlike Banking—Are Operating Normally • The Basic Function of Insurance—the Orderly Transfer of Risk from Client to Insurer—Continues Uninterrupted • This Means that Insurers Continue to: • Pay claims (whereas 27 banks have gone under) • The Promise is Being Fulfilled • Renew existing policies (banks are reducing and eliminating lines of credit) • Write new policies (banks are turning away people who want or need to borrow) • Develop new products (banks are scaling back the products they offer) Source: Insurance Information Institute
Reasons Why P/C Insurers Have Fewer Problems Than Banks: A Superior Risk Management Model • Emphasis on Underwriting • Matching of risk to price (via experience and modeling) • Limiting of potential loss exposure • Some banks sought to maximize volume and fees and disregarded risk • Strong Relationship Between Underwriting and Risk Bearing • Insurers always maintain a stake in the business they underwrite, keeping “skin in the game” at all times • Banks and investment banks package up and securitize, severing the link between risk underwriting and risk bearing, with (predictably) disastrous consequences—straightforward moral hazard problem from Econ 101 • Low Leverage • Insurers do not rely on borrowed money to underwrite insurance or pay claimsThere is no credit or liquidity crisis in the insurance industry • Conservative Investment Philosophy • High quality portfolio that is relatively less volatile and more liquid • Comprehensive Regulation of Insurance Operations • The business of insurance remained comprehensively regulated whereas a separate banking system had evolved largely outside the auspices and understanding of regulators (e.g., hedge funds, private equity, complex securitized instruments, credit derivatives—CDS’s) • Greater Transparency • Insurance companies are an open book to regulators and the public Source: Insurance Information Institute
Financial Institutions Globally FacingHuge Losses from the Credit Crunch* Billions The IMF estimates total “credit- turmoil-related” losses will eventually amount to $1.4 trillion $205B or 20.8% of estimated total (bank+insurer) losses will be sustained by insurers worldwide *Global losses since the beginning of 2007.Source: IMF Global Financial Stability Report, October 2008, IIF, Bloomberg, cited in a presentation by Thomas Hess (Chief Economist, Swiss Re) October 23, 2008, accessed via Geneva Association web site.
US Bank Failures:* 1995-2009** Through January 23, 2009 Bank failures are up sharply. 27 banks (but no p/c or life insurers) failed in 2008/09 due to the financial crisis, including the largest in history—Washington Mutual with $307B in assets. Remarkably, as recently as 2005 and 2006, no banks failed—the first time this had happened in FDIC history (dating back to 1934) *Includes all commercial banking and savings institutions. **Through Jan. 23. Source: FDIC: http://www.fdic.gov/bank/historical/bank/index.html; Insurance Info. Institute
Top 10 P/C Insolvencies, Based Upon Guaranty Fund Payments* $ Millions The 2001 bankruptcy of Reliance Insurance was the largest ever among p/c insurers * Disclaimer: This is not a complete picture. If anything the numbers are understated as some states have not reported in certain years. Source: National Conference of Insurance Guaranty Funds, as of September 17, 2008.
P/C INSURANCE FINANCIAL PERFORMANCEA Resilient Industry in Challenging Times
P/C Net Income After Taxes1991-2009F ($ Millions)* • 2001 ROE = -1.2% • 2002 ROE = 2.2% • 2003 ROE = 8.9% • 2004 ROE = 9.4% • 2005 ROE= 9.4% • 2006 ROE = 12.2% • 2007 ROAS1 = 12.3% • 2008 ROAS = 1.1%* Insurer profits peaked in 2006. *ROE figures are GAAP; 1Return on avg. surplus.2008 numbers are annualized based on 9-mos. Actual of $4.066 billion. Sources: A.M. Best, ISO, Insurance Information Inst.
P/C Insurance Industry ROEs,1975 – 2008E* 1977:19.0% 1987:17.3% 2006:12.2% 1997:11.6% 10 Years 10 Years 9 Years 2008E: 1.1% 1975: 2.4% 1984: 1.8% 1992: 4.5% 2001: -1.2% Note: 2009 figure is actual 9-month result. Sources: ISO;Insurance Information Institute.
ROE vs. Equity Cost of Capital:US P/C Insurance:1991-2008:Q3 The p/c insurance industry fell well short of is cost of capital in 2008 +2.3 pts -1.7 pts -9.0 pts -13.2 pts -9.7 pts US P/C insurers missed their cost of capital by an average 6.7 points from 1991 to 2002, but on target or better 2003-07 The cost of capital is the rate of return insurers need to attract and retain capital to the business *Excludes mortgage and financial guarantee insurers. Source: The Geneva Association, Ins. Information Inst.
Presidential Politics & P/C InsuranceHow is Profitability Affected by the President’s Political Party?
P/C Insurance Industry ROE byPresidential Administration,1950-2008* OVERALL RECORD: 1950-2008* Democrats 8.05% Republicans 8.02% Party of President has marginal bearing on profitability of P/C insurance industry *ROE for 2008 based on H1 data. Truman administration ROE of 6.97% based on 3 years only, 1950-52. Source: Insurance Information Institute
Investment Performance Investments are the Principle Source of Declining Profitability
Property/Casualty Insurance Industry Investment Gain:1994- 2008:Q3 1 Investment gains are off sharply in 2008 due to lower yields and poor equity market conditions. 1Investment gains consist primarily of interest, stock dividends and realized capital gains and losses. 2006 figure consists of $52.3B net investment income and $3.4B realized investment gain. *2005 figure includes special one-time dividend of $3.2B. Sources: ISO; Insurance Information Institute.
P/C Insurer Net Realized Capital Gains, 1990-2008:Q3 $ Billions Realized capital gains exceeded $9 billion in 2004/5 but fell sharply in 2006 despite a strong stock market. Nearly $9 billion again in 2007, but $-9.7 billion in 2008 through Q3. Sources: A.M. Best, ISO, Insurance Information Institute.
Underwriting TrendsFinancial Crisis Does Not Directly Impact Underwriting Performance: Cycle, Catastrophes Were 2008’s Drivers
P/C Insurance Industry Combined Ratio, 2001-2009E As recently as 2001, insurers paid out nearly $1.16 for every $1 in earned premiums Relatively low CAT losses, reserve releases Including Mortgage & Fin. Guarantee insurers 2005 ratio benefited from heavy use of reinsurance which lowered net losses Cyclical Deterioration Best combined ratio since 1949 (87.6) *Includes Mortgage & Financial Guarantee insurers. Sources: A.M. Best.
Underwriting Gain (Loss)1975-2008:Q3* Insurers earned a record underwriting profit of $31.7 billion in 2006, the largest ever but only the second since 1978. Cumulative underwriting deficit from 1975 through 2007 is $422 billion. $ Billions $19.877 Bill underwriting loss in 08:9M incl. mort. & FG insurers Source: A.M. Best, ISO; Insurance Information Institute * Includes mortgage & finl. guarantee insurers
Number of Years With Underwriting Profits by Decade, 1920s –2000s Number of Years with Underwriting Profits Underwriting profits were common before the 1980s (40 of the 60 years before 1980 had combined ratios below 100)—but then they vanished. Not a single underwriting profit was recorded in the 25 years from 1979 through 2003. Note: Data for 1920 – 1934 based on stock companies only. Sources: Insurance Information Institute research from A.M. Best Data. *2000 through 2008.
Personal LinesCombined Ratio, 1993-2009F 2008 deterioration due to price competition and higher CAT losses. Trends reverse in 2009. Improvement in 2009 assumes reasonable degree of underwriting discipline and average CAT activity ($10 B -$12B) Source: A.M. Best (historical and forecast).
Commercial Lines Combined Ratio, 1993-2009F Commercial coverages have exhibited significant variability over time. Mortgage and financial guarantee may account for up to 4 points on the commercial combined ratio in 2008 2006/07 benefited from favorable loss cost trends, improved tort environment, low CAT losses, WC reforms and reserve releases. Most of these trends reversed in 2008 and mortgage and financial guarantee segments have big influence. 2009 is transition year. Sources: A.M. Best (historical and forecasts)
Catastrophe LossesImpacting Underwriting Results and the Bottom Line
U.S. Insured Catastrophe Losses* $ Billions $100 Billion CAT year is coming soon 2008 CAT losses exceeded 2006/07 combined. 2005 was by far the worst year ever for insured catastrophe losses in the US, but the worst has yet to come. *Excludes $4B-$6b offshore energy losses from Hurricanes Katrina & Rita. **Based on PCS data through Dec. 31. PCS $2.1B loss of for Gustav. $10.655B for Ike of 12/05/08. Note: 2001 figure includes $20.3B for 9/11 losses reported through 12/31/01. Includes only business and personal property claims, business interruption and auto claims. Non-prop/BI losses = $12.2B. Source: Property Claims Service/ISO; Insurance Information Institute
Capital/Policyholder SurplusShrinkage, but Capital is Within Historic Norms
U.S. Policyholder Surplus: 1975-2008* Actual capacity as of 9/30/08 was $478.5, down 7.6% from 12/31/07 at $517.9B, but 68% above its 2002 trough. Recent peak was $521.8 as of 9/30/07. Estimate as of 12/31/08 is $438B is 16% below 2007 peak. $ Billions The premium-to-surplus ratio stood at $0.94:$1 at year end 2008, up from near record low of $0.85:$1 at year-end 2007 “Surplus” is a measure of underwriting capacity. It is analogous to “Owners Equity” or “Net Worth” in non-insurance organizations Source: A.M. Best, ISO, Insurance Information Institute. *Towers Perrin estimate as of 12/31/08
Policyholder Surplus, 2006:Q4 – 2008:Q4(Est.) Capacity peaked at $521.8 as of 9/30/07 Declines Since 2007:Q3 Peak Q2: -$16.6B (-3.2%) Q3E: -$43.3B (-8.3%) Q4E: -$84B (-16.1%) Source: ISO (historical); Towers Perrin (Oct. 21) estimates for Q4 2008. Q4 assumes no major Investment market recovery before year-end 2008.
U.S. P/C Industry Premiums-to-Surplus Ratio: 1985-2008:Q3 Premiums measure risk accepted; surplus is funds beyond reserves to pay unexpected losses. The larger surplus is in relation to premiums—the lower the ratio of premiums to surplus—the greater the industry’s capacity to handle the risk it has accepted. P/C insurers remain well capitalized despite recent erosion of capital 19980.85:1–the lowest (strongest) P:S ratio in recent history. 0.92:1 as of 9/30/08 Sources: A.M. Best, ISO, Insurance Information Institute.
Historically, Hard Markets Follow When Surplus “Growth” is Negative Sharp decline in capacity is a necessary but not sufficient condition for a true hard market *Actual 9-month 2008 result. Sources: A.M. Best, ISO, Insurance Information Institute