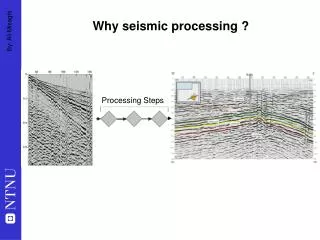
Why seismic processing ?
Processing Steps. Why seismic processing ?. + Noise (t) =. Seismic trace. R(t). S(t). Rf(t). Sandstone. Coal. Carbonate. Salt. Shale. What’s a seismic trace?. *. *. Deconvolution. Filtering Stacking. f(t). g(t). *. f(t). g(t). *. Wave propagation. Marine data.

Why seismic processing ?
E N D
Presentation Transcript
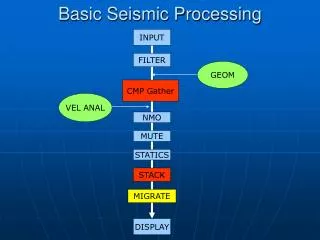
Processing Steps Why seismic processing ?
+ Noise (t) = Seismic trace R(t) S(t) Rf(t) Sandstone Coal Carbonate Salt Shale What’s a seismic trace? * * Deconvolution Filtering Stacking . . .
f(t) g(t) * f(t) g(t) *
Marine data Land data Split shot gather
Seismic eventsNon-primary events R1 R2 Direct Primary Head wave (refraction) First multiple Ground roll
Seismic eventsNon-primary events Direct P-wave Ground roll Earth’s surface R1 S R2 Subsurface reflector First multiple Head wave (refraction) Primary
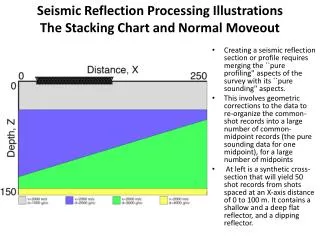
Number of receivers x receiver interval CDP Fold = 2 x shot interval
CDP gather NMO Stack
Migration “The goal of migration is to make the stacked section appear similar to the geologic cross-section” Oz Yilmaz
A step in seismicprocessing in which reflections in seismic data are moved to their correct locations in the x-y-time space of seismic data, including two-way traveltime and position relative to shotpoints
m n Zm Zn
Examining the normal moveout equation, it is possible to analyze NMO velocities by plotting reflections in T2 X2 space
Concept of Constant Velocity Stack as an aid to stacking velocity estimation.
One method to determine stacking velocity is to use a Constant Velocity Stack (CVS) for several CDP gathers
Same CVS panel of traces as before switching to variable density color for the traces to utilize dynamic range
Same as previous color panels with velocity range now halved to better pick correct velocities
CDP gather with NMO applied (center) surrounded by panels having progressively lower velocity (left) or higher velocity.
From left to right are panels for Semblance, Gather, Dynamic Stack, Flip Stacks, and Velocity Function Stack.
The ProMax routine ‘Velocity Analysis’ has it all – from left to right: velocity spectra, interactive cursor with CDP gather, dynamic stack, and a variation on CVS
The Semblance Panel shows the semblance plot, the picked velocity function, guide functions, and the interval velocity computed from the picked function.
Dix equation converts stacking velocities to interval velocities.
However, you get RMS velocities, one can continue to calculate interval velocities, interval thicknesses, and average velocities.
A common problem with stacking is residual NMO on the CDP gathers resulting from imperfect velocity specification.
Example of the data/velocity Interleave Display using Landmark’s SeisCube program.
Prestack CDP gather with a horizon plotted along an event that is not perfectly flattened by NMO; other causes might be statics, noise, and/or lithology that is affecting the phase.
ProMax routine CDP/Ensemble Stack vertically stacks input ensembles of traces.
Definition of multiplies as it applies to processing seismic reflection data using ProMax.
Example of a surface multiple on left in red and intrabed multiple on the right in blue.