Hookers Sea Lion
Hookers Sea Lion (Phocarctos hookeri) Found only in NZ ... Contrast with western stock of Stellers Sea Lion. Predicting Extinction. 12. Our model ...

Hookers Sea Lion
E N D
Presentation Transcript
Predicting Extinction The Hooker’s Sea Lion Predicting Extinction
Nature of extinction • The taxonomic group of interest has no members (in the wild or captivity?) • caused by an average negative rate of increase for a long period of time Predicting Extinction
Causes of extinction • Competition predation • Climate Change • Habitat loss • Exotic species introductions • Disease • Other catastrophic event • Exploitation Predicting Extinction
Modeling extinction • Random walk with negative or close to negative rates of increase Predicting Extinction
Key parameters • Average rate of increase • Process error • Starting population size • Pseudo-extinction threshold • Often ignored - red noise autocorrelation of process errors - show general model! Predicting Extinction
What is missing • Density dependence, especially decreasing rates of increase at very low densities • Catastrophic events Predicting Extinction
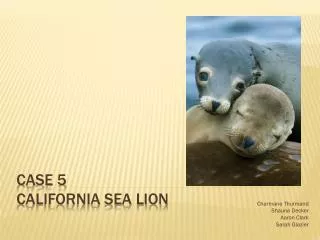
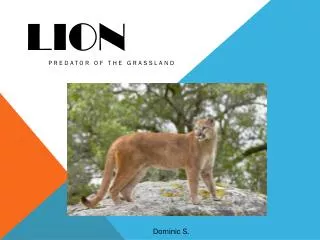
Hookers Sea Lion(Phocarctos hookeri) • Found only in NZ • Main breeding sites are in Auckland Islands • Historical range may have included main islands • depleted to near extinction in 18th and 19th centuries Predicting Extinction
Concerns • Listed as vulnerable - then upgraded to threatened, based on the lack of breeding sites at places other than Auckland Islands • Population size estimated at 14,000 animals • about 80 per year killed as by-catch in squid fishery • NZ DOC wants to limit by-catch by closure of squid fishery Predicting Extinction
Goals • Allow population to increase so that colonization at a new site takes place • Best way to achieve this is by letting population reach 90% of K • Contrast with western stock of Stellers Sea Lion Predicting Extinction
Our model • Spatially explicit 8 populations • Dispersal between sites • Allowed for depensation • Allowed for catastrophic events • Used existing data in integrated Bayesian framework Predicting Extinction
The problem • Estimate impacts of squid fishery by-catch on two major indicators • Probability of extinction • Probability of establishing new breeding colonies Predicting Extinction
Key components of approach • Model to estimate parameters from available data • Forward projections to calculate impacts of by-catch and catastrophies • Literature review to determine intensity and probability of catastrophies • Literature review to determine what is known about population dynamics of otariids Predicting Extinction
Data available • Irregular pup counts at some of the locations Predicting Extinction
Key elements of model • Age structured • 8 possible breeding sites • model dispersal between sites • allow for depensation • allow for catastrophic events Predicting Extinction
Why age structure? • The “important” parameter is rate of increase - a total numbers model would be appropriate • But -- the data are pup counts - keeping track of age structure lets us predict observed pups Predicting Extinction
Key parameters • Pups per female • juvenile survival • adult survival • only one aggregate rate of increase is really estimable! Predicting Extinction
Density dependence • Wanted flexible model to allow for different shapes in production curve Predicting Extinction
Why spatial model? • Additional breeding sites may make population less vulnerable to catastrophic events • Data come in different years from different sites, thus we can’t “pool” Auckland Islands data into one area Predicting Extinction
Alternative model of dispersal • From Barb Taylor - build up at beaches until density is high - then large numbers move to new site - usually a few miles away • This could be modeled, but obviously would be unlikely to move animals outside the Auckland Islands • Might want to make the probability of dispersal a higher power of density Predicting Extinction
Key assumptions in dispersal model • The proportion that disperse increases with density so that when density doubles the number dispersing goes up four times • Probability of dispersal from one area to another decreases with distance between sites Predicting Extinction
Why depensation? • We need to consider the possibility that rates of increase decline at low densities, this is a common hypothesis for causes of extinction • We used an exponential model but do not believe the particular shape is important • There is information about depensation from the data on New Zealand sea lions, and in the historical record Predicting Extinction
Model derivation • Assumes a random “mating” model, that the probability a female goes unmated is the probability of her not encountering a mate, and this encounter rate is random. Predicting Extinction
Our likelihood • Chose normal likelihood with different s.d. for each population • s.d. was chosen based on a CV of 0.5 except for the three populations with 1 or 2 animals counted • For all except Sandy the empirical CV is about 0.5 Predicting Extinction
Why catastrophic events • Most of the concern about threat to NZ sea lions relates to the impact of catastrophic events • If we want to model extinction risk or changes in abundance we have to model catastrophic events Predicting Extinction
Our model • The probability of a catastrophic event is the same in all years • All individuals of all ages are equally affected • Two choices - all areas affected equally, or Auckland Islands together, all others independent Predicting Extinction
Other models • The intensity or probability of a catastrophic event could be density dependent (disease and contact rates) • Only breeding (or non breeding) animals are affected Predicting Extinction
Why look at only “big” events • If we want to consider “small” events - i.e. pup die offs, 20% mortalities, then we would need to consider the possibility that these have occurred in the last 30-40 years, and therefore the observed rates of increase reflect “small” events • This is technically hard to do and should “automatically” be incorporated in observed rates of increase Predicting Extinction
Choices in the meta analysis of catastrophies • Two types of major catastrophic events in otariids - the long slow declines of Western Steller’s and South American sea lions, and the El Nino type declines in the eastern Pacific. • We found 7 such events with 50% or greater mortality Predicting Extinction
What denominator to use • If we use only years where current scientific methods for pup counts were used, we obtain a denominator of 273 and a probability of 2.5%. • This obviously greatly overestimates the probability, Predicting Extinction
How likely are we to have observed a massive mortality • Clearly none has happened for at least 30 years with NZ sea lion - yet we used only 2 years data for out 2.5% calculation • If we use the length of the historical record we obtain 0.28% • This is too low • We chose 1% effectively saying there is a 25% chance of having observed a massive mortality at any time in the historical record Predicting Extinction
Depensation • Reviewed the entire published literature for all otariids (sea lions and fur seals) • found that numerous populations had been driven low enough to be thought extinct by exploitation • had all recovered from such low levels • other analysis in progress Predicting Extinction
Catastrophic events • Considered only events of 50% or greater mortality on reproductive individuals • Seven such events: what denominator to use • If we assume only when populations closely monitored we get 2% probability • Our best estimate is 1% probability Predicting Extinction
General conclusions • Risk of extinction is quite low, IUCN criterion is 10% probability in 100 years, we are 1/20th of that • Highly unlikely that new breeding colonies will be formed in next 20 years • By-catch has very small impact on population, dynamics dominated by catastrophes Predicting Extinction
Model improvements • Add process error other than catastrophes • Likelihood for low counts • Accounting for small populations • Better quantification of priors -- especially for depensation and catastrophes Predicting Extinction